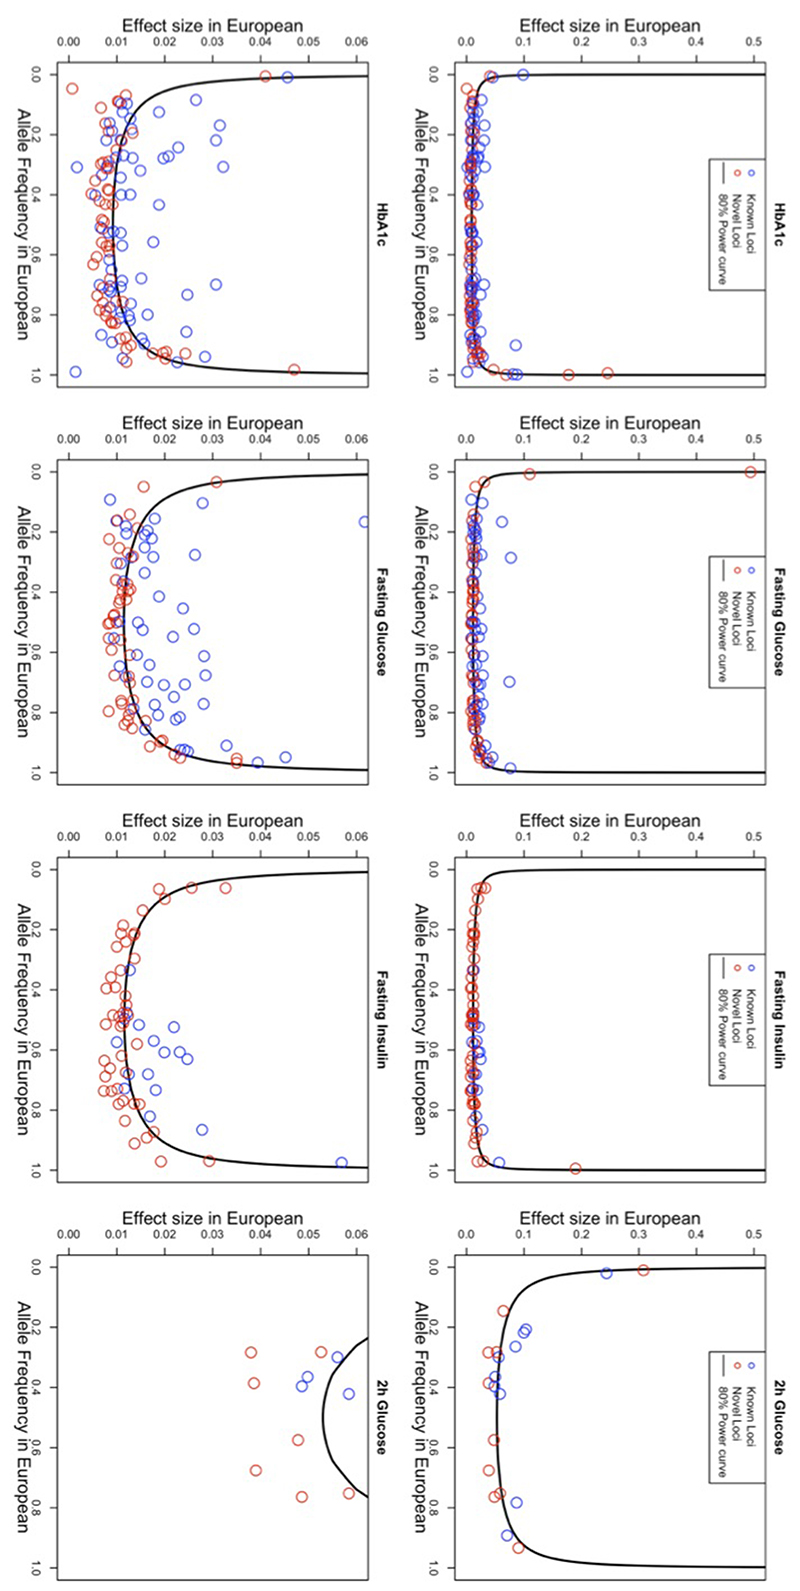
Extended Data Fig. 4. Allele frequency versus effect size.
Allele frequency versus effect size for all signals detected through the trans-ancestry meta-analyses, for each of the four traits. Frequency and effect size are from the European meta-analyses. The power curves were computed based on the European sample size for each trait, and the mean (m) and standard deviation (sd) computed on the FENLAND study: FG, m=4.83 mmol/l, sd=0.68; FI, m=3.69 mmol/l, sd=0.60; 2hGlu, m=5.30 mmol/l, sd=1.74; HbA1c, m=5.55%, sd=0.48.

