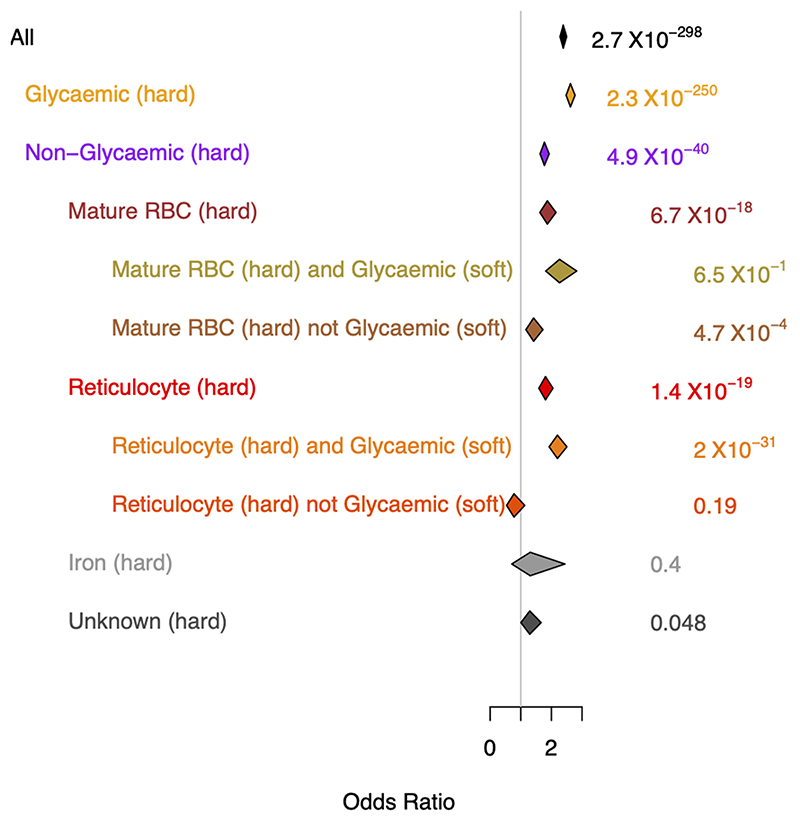
Extended Data Fig. 6. Forest plot of T2D GRS from HbA1c variants.
The p-value on the right side is from the two-side test without multiple testing corrections. Vertical points of each diamond represent the point estimate of the odds ratio. The horizontal points of each diamond represent the 95% confidence interval of the odds ratio. Figure shows the association results between HbA1c-associated variants built into a GRS for T2D by taking each HbA1c-associated variant and using a weight that corresponds to its T2D effect size (logOR) based on analysis by the DIAGRAM consortium. The overall GRS is subsequently partitioned according to the HbA1c signal classification. The overall and partitioned GRS were tested for association with T2D based on data from UK biobank.

