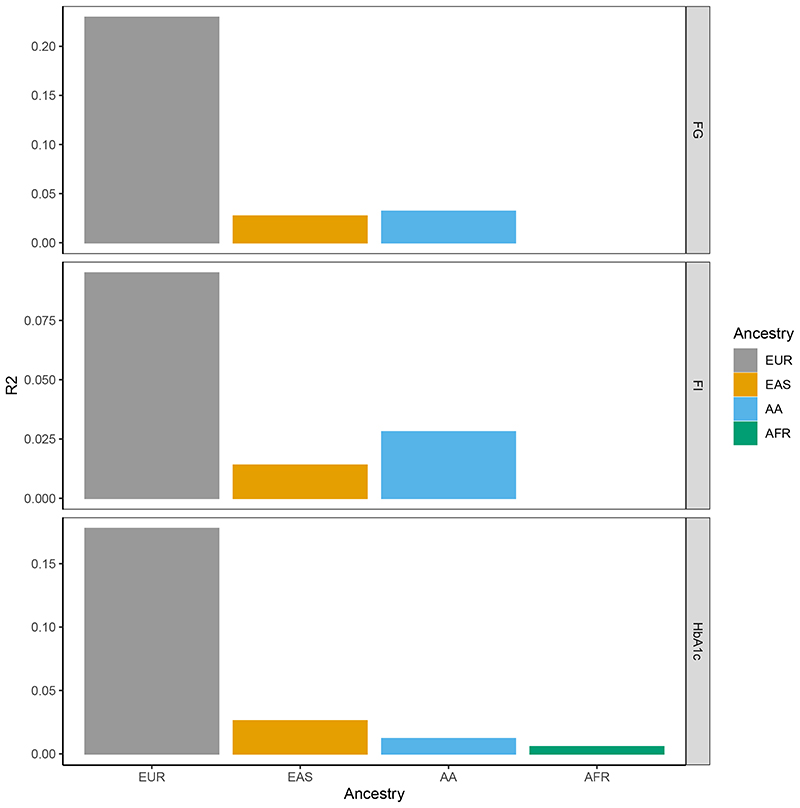
Figure 3. Transferability of PGS across ancestries.
For each trait, the barplots represent trait variance explained when using a European ancestry-derived PGS in European, East Asian and African American test datasets. Variance explained (the height of each bar) for each trait (FG, FI and HbA1c) in each ancestry is shown on different panels and in different colors.

