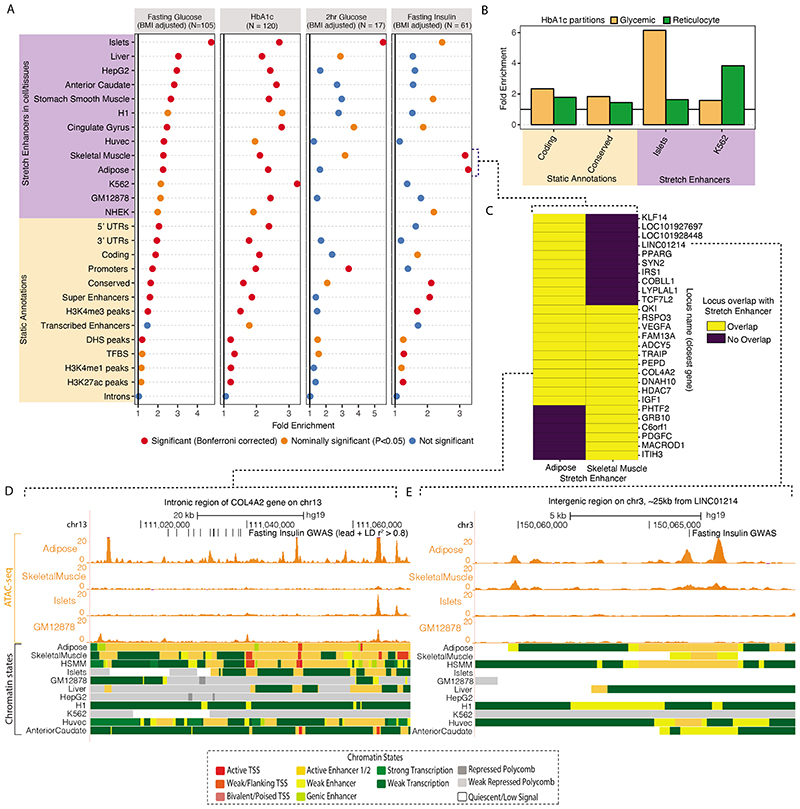
Figure 5. Epigenomic landscape of trait-associated variants.
A: Enrichment of GWAS variants to overlap genomic regions including ‘Static Annotations’ which are common or ‘static’ across cell types and ‘Stretch Enhancers’ which are identified in each tissue/cell type. The numbers of signals for each trait are indicated in parentheses. Enrichment was calculated using GREGOR 56. One-sided test for significance (red) is determined after Bonferroni correction to account for 59 total annotations tested for each trait; nominal significance (P<0.05) is indicated in yellow. B: Enrichment for HbA1c GWAS signals partitioned into “hard” Glycemic and Red Blood Cell cluster (signals from “hard” mature Red Blood Cell and reticulocyte clusters together) to overlap annotations including StrEs in Islets and the blood-derived leukemia cell line K562, respectively (additional partitioned results in Supplementary Table 17). C: Individual FI GWAS signals that drive enrichment in Adipose and Skeletal Muscle StrEs. D, E: Genome browser shots of FI GWAS signals – intronic region of the COL4A2 gene (D) and an inter-genic region ~25kb from LINC01214 gene (E) showing GWAS SNPs (lead and LD r2>0.8 proxies), ATAC-seq signal tracks and chromatin state annotations in different tissues/cell types.

