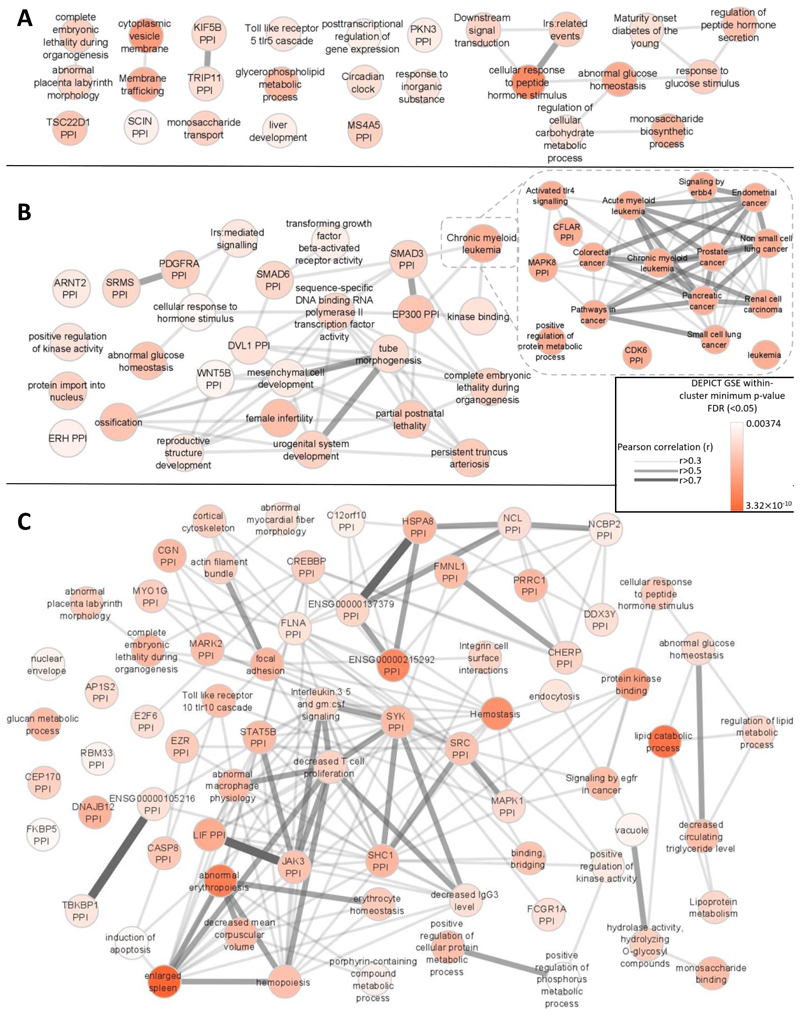
Figure 7. Gene-set enrichment analyses.
Results from affinity-propagation clustering of significantly enriched gene-sets (FDR<0.05) identified by DEPICT for A) FG, B) FI, and C) HbA1c. Each node is a meta gene-set which is represented by an exemplar gene-set within the meta gene-set. For example, in B. “chronic myeloid leukemia “ is an exemplar gene-set representing a much broader meta gene-set relating to cancer and represented in the zoomed in section on the right. Similarities between the meta gene-sets are represented by Pearson correlation coefficients (r>0.3). The nodes are colored according to the minimum gene-set enrichment p-value for gene-sets in that meta gene-set.. PPI=protein-protein interaction network.

