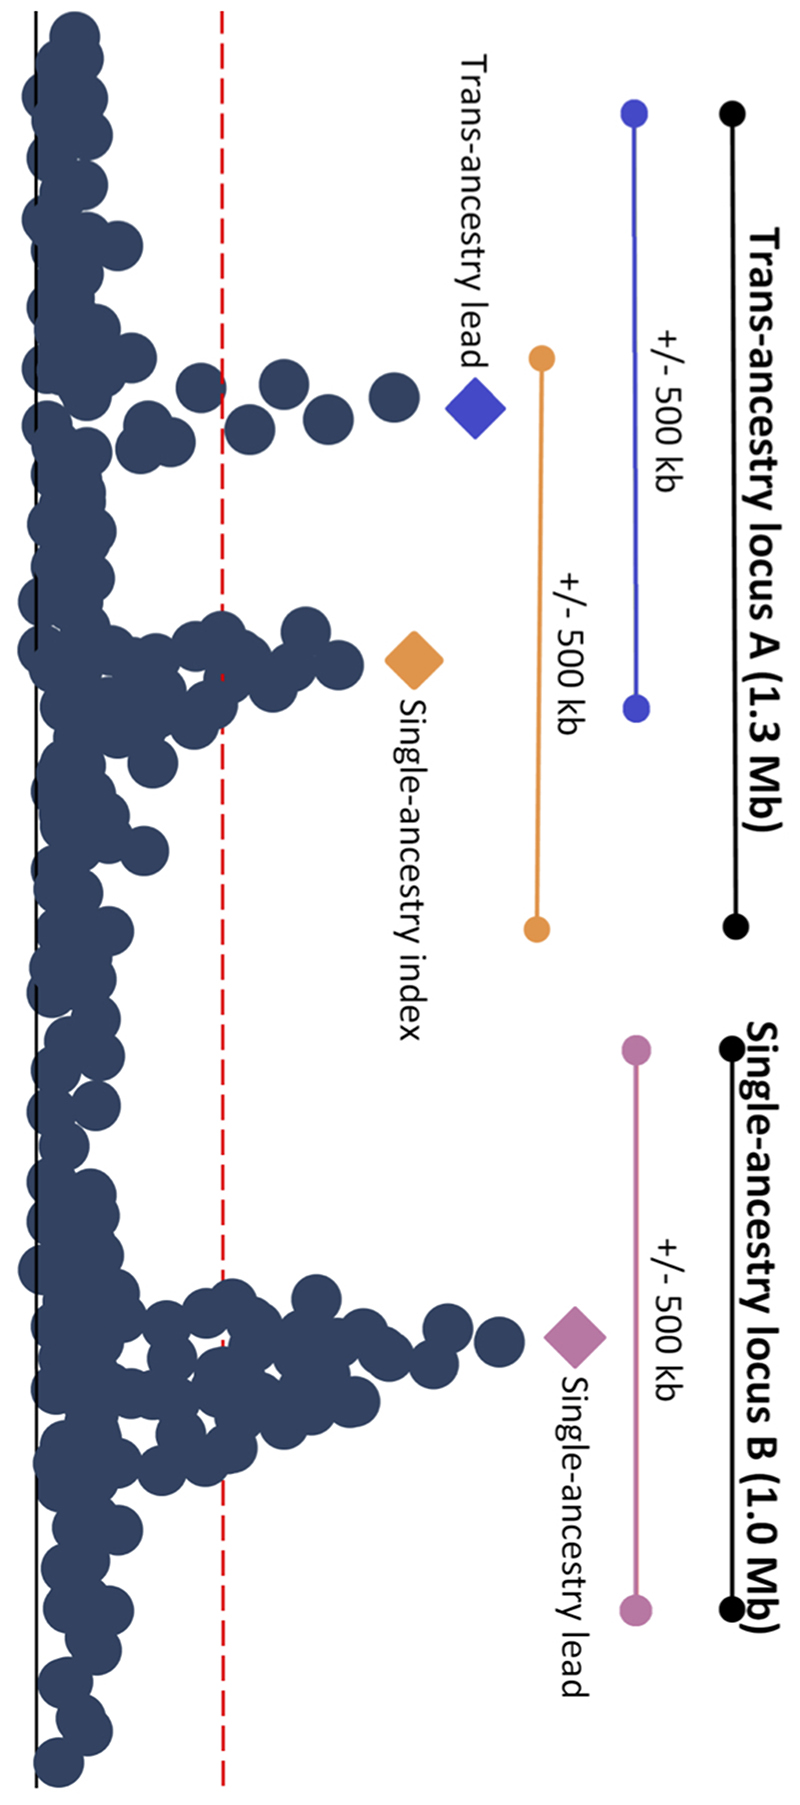
Extended Data Fig. 2. Locus diagram.
Trans-ancestry locus A contains a trans-ancestry lead variant for one glycemic trait represented by the blue diamond, and another single-ancestry index variant for another glycemic trait represented by the orange triangle. Single-ancestry locus B contains a single-ancestry lead variant represented by the purple square. The orange, blue and purple bars represent a +/- 500Kb window around the orange, blue, and purple variants, respectively. The black bars indicate the full locus window where trans-ancestry locus A contains trans-ancestry lead and single-ancestry index variants for two traits and single-ancestry locus B has a single-ancestry lead variant for a single trait.

