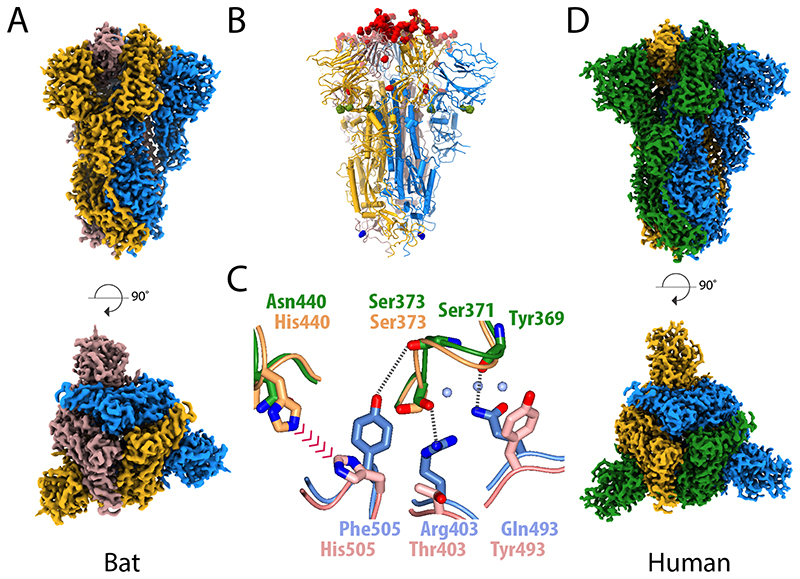
Figure 2. Structural comparison of the spike glycoprotein from the bat virus RaTG13 and SARS-CoV-2.
(A) The density map for the bat virus trimeric S is shown with the long axis vertical in the top panel and viewed orthogonally in the bottom panel. All of the particles are in the closed conformation likely because of the cross-linking of the material. The three monomers are coloured blue, yellow and brown. (B) Molecular model of the bat virus S protein, coloured as in (A), with substitutions between the bat virus and SARS-CoV-2 highlighted. Most of the changes are in the RBD and coloured red, there are four substitutions in S1 outside of the RBD, which are shown in green, and a single substitution in S2 shown in blue. (C) Overlay of the molecular structure of a portion of the RBD–RBD interface; the two bat virus S monomers are coloured gold (upper) and pink (lower) while the two superposed SARS-CoV-2 S RBD chains are shown in green (upper) and blue (lower). Analysis suggests that the residues at the interface of SARS-CoV-2 S RBD chains support several additional stabilising interactions and avoid potential steric repulsion between His505 and His440 seen in the bat virus structure. (D) The density map for the uncleaved SARS-CoV-2 S protein, in the closed conformation, shown in the same orientation as (A) with the subunits coloured blue, green and yellow. This sample gave the best quality maps and enabled the most extensive build of the polypeptide chain.

