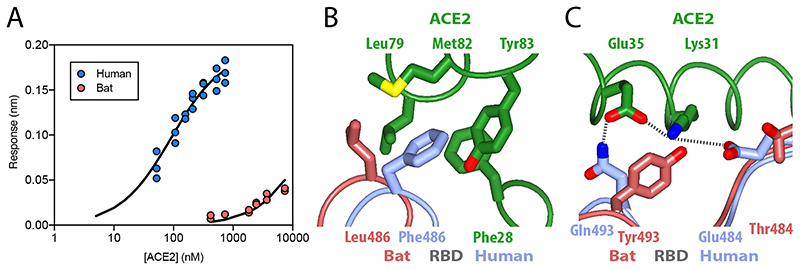
Figure 3. Binding of ACE2 receptor to bat virus and SARS-CoV-2 spike protein.
(A) Plot of surface biolayer amplitude measurement as a function of ACE2 concentration with the data for spike from SARS-CoV-2 (blue, Kd calculated as 91 ± 18 nM) and from the bat virus (red, Kd estimated to be >40 μM). The equilibrium dissociation constant for SARS-CoV-2 protein calculated from kinetic constants (koff = 0.0105 s-1 and kon = 1.56 x 10⁵ M-1s-1) was 67.5 +/- 9 nM. (B & C) Ribbon representation of modelled molecular interactions between ACE2 (green) with RBD from spike in SARS-CoV-2 (blue) (both PDB 6VW121) and bat virus (brown, this study). (B) Details of a hydrophobic pocket on ACE2 that accommodates a phenylalanine residue from the SARS-CoV-2 S RBD. (C) Shows two salt bridges and a charged hydrogen bond linking SARS-CoV-2 S RBD to ACE2, while the interface with bat virus S RBD is not able to make these interactions and presents a potential steric clash between SARS-CoV-2 RBD Tyr493 with ACE2 Lys31.

