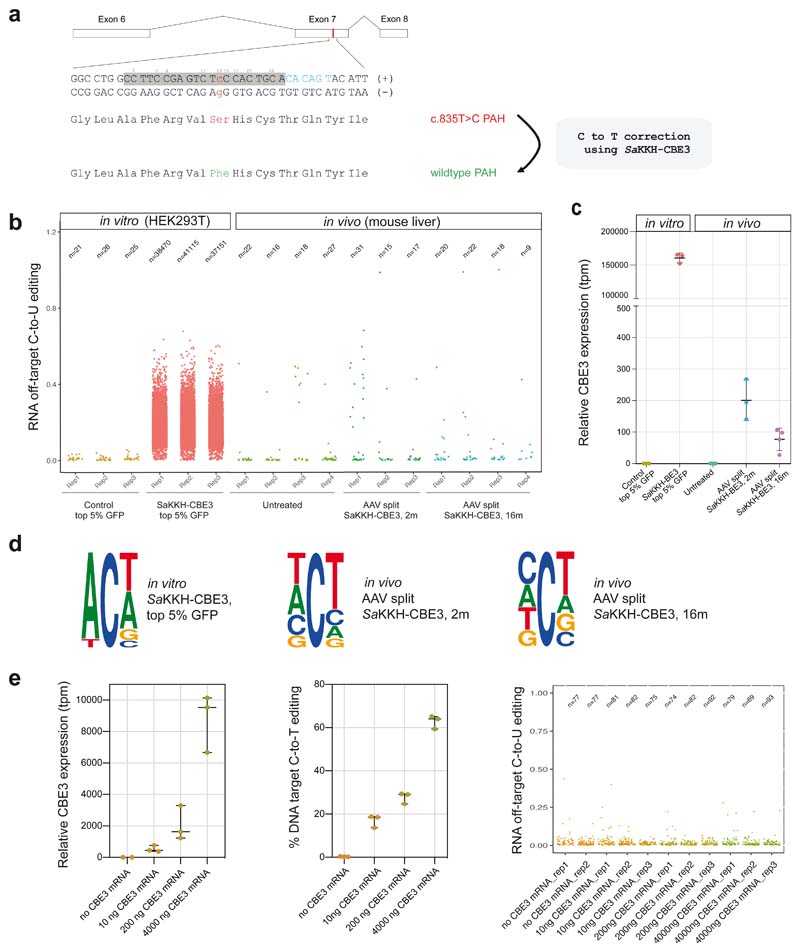
Figure 1. Transcriptome-wide C-to-U editing analysis after AAV-mediated SaKKH-CBE3 treatment.
a)The mutant Pahenu2 allele that harbours the disease-causing c.835T>C (p.F263S) mutation (red) on Exon 7 was corrected using SaKKH-CBE3. The sgRNA binds the protospacer (grey) and NNNRRT PAM site (blue). All Cs within the protospacer region are indicated (C2-C20). A Ser to Phe amino acid change at position 263 restores PAH enzyme activity. b) Transcriptome-wide C-to-U editing events are represented as single dots (exact numbers are indicated above, n). Values were derived from 3-4 biolgically independent replicates. in vitro RNA-seq data are from HEK293T cells co-transfected with SaKKH-CBE3, the Pahenu2 -targeting sgRNA, and a GFP-expressing plasmid, sorted for top 5% GFP expression. In vivo RNA-seq data are from mice treated with adeno-associated virus (AAV) to express SaKKH-CBE3 and the Pahenu2 -targeting sgRNA. Control mice were not injected. in vitro samples were analysed 72 hours after transfection. AAV treated mice were analysed 2 months or 16 months after injection of 5 × 10¹¹ vg per AAV vector. c) Relative SaKKH-CBE3 expression levels (rAPOBEC1, tpm=transcripts per million) of samples analysed in b). n = 3 or 4 biologically independent experiments, represented by individual dots. Values represent mean ± s.d. d) Sequence motifs of representative data sets. The motifs were derived from accumulated RNA C-to-U edits of 3 biologically independent replicates per group. in vitro SaKKH-CBE3-treated samples exhibit a typical APOBEC1 ACW motif. Ts should be considered as Us. The motifs depict base probability as letter size. e) SaKKH-CBE3 expression was titrated by transfecting different concentrations of SaKKH-CBE3 mRNA and in vitro transcribed sgRNA into HEK293T cells with exon 7 of Pahenu2 stably integrated. The first panel depicts relative expression of the base editor, the second panel shows corresponding C-to-T edits at the genomic target locus and panel three shows corresponding RNA C-to-U editing events of the samples analysed in panel one and two. Cells were harvested 48 hours after transfection and sorted for co-transfected mCherry expression. n = 3 biologically independent experiments, represented by individual dots. Values represent mean ± s.d. Each dot in panel three represents one C-to-U editing event. Total numbers are indicated above (n). Replicates represent biologically independent replicates.

