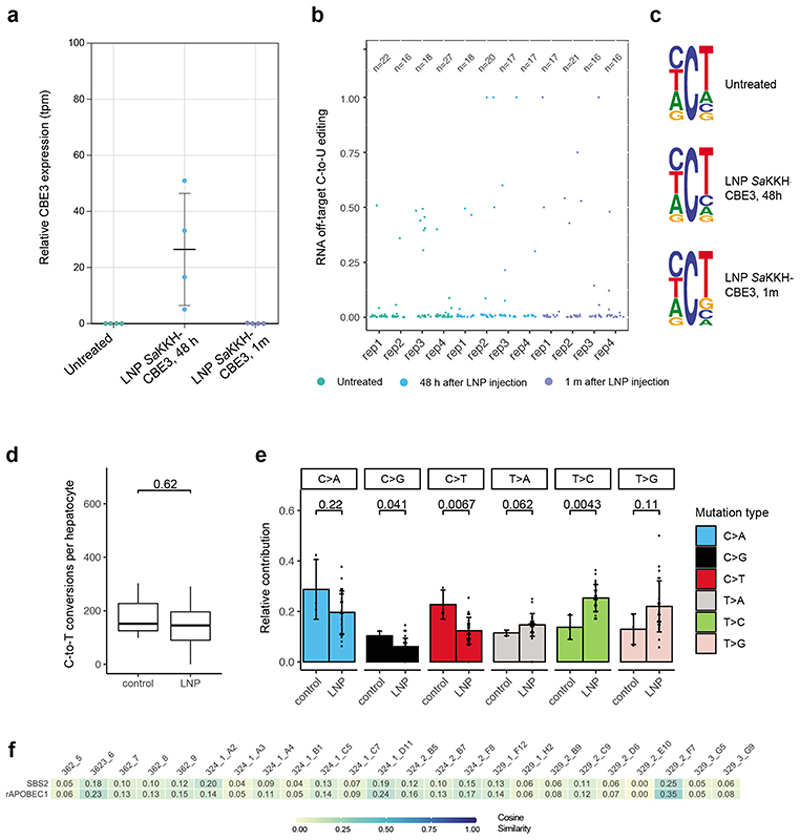
Figure 4. Transcriptome- and genome-wide off-target analysis after LNP-mediated SaKKH-CBE3 treatment.
a)Relative SaKKH-CBE3 expression levels (quantified by rAPOBEC1 expression, tpm=transcripts per million) of untreated mouse livers (n=4) and edited mouse livers 48 hours or 1 month after LNP treatment (n=4). Shown are biologically independent replicates, where n is indicated as individual dots. Values represent mean ± s.d. b) Jitter plots show transcriptome-wide C-to-U editing events. RNA-seq data from untreated mouse livers and LNP-treated livers analysed 48 hours or 1 month after injection. Each dot represents one editing event, exact values are indicated above (n). c) Sequencing motifs for all RNA C-to-U editing events shown in b). Motifs were derived from cumulated RNA C-to-U edits of 3 independent replicates per sample. Ts should be considered as Us. The motifs depict base probability as letter size. d) C·G to T·A editing events were summarized as C-to-T conversions per hepatocyte clone. 24 clones were derived from LNP-treated mice, and 3 clones from untreated control mice. Box plots are standard Tukey plots, where the centre line represents the median, the lower and upper hinges represent the first and third quartiles, and whiskers represent + 1.5 the interquartile range. Wilcoxon test was used for comparison. e) Relative contributions of single base substitutions observed in the genome of hepatocytes isolated from LNP-treated mice (n=24) versus hepatocytes isolated from control mice (n=3). Their frequency in the genome (y-axis) is shown. C>A includes G>T, C>G includes G>C, C>T includes G>A, T>A includes A>T, T>C includes A>G and T>G includes A>C conversions. Values represent mean ± s.d. Wilcoxon test was used for comparison. f) Heatmap showing the cosine similarity of mutational signatures from each clones to the COSMIC signature SBS240 and the predetermined rat APOBEC1 signature10 as displayed in Suppl. Fig. 10. Heatmap; 1=exact match, 0=no similarity observed.

