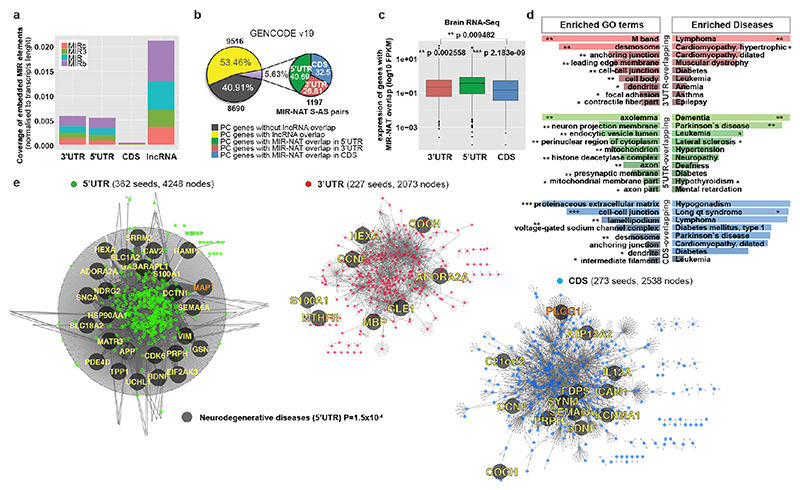
Extended Data Figure 8. MIR-NATs S-AS pairs within networks of interacting proteins, enriched for NDD-genes.
a, MIRs are more frequent in lncRNAs than mRNAs (5’UTR, 3’UTR, CDS). b, 1,197 GENCODE v19 MIR-NATs form S-AS pairs with 1,045 protein-coding (PC) genes: 40.69% overlap 5’UTR, 32.50% overlap CDS and 26.81% overlap 3’UTR. c, PC-genes with 5’UTR-overlapping MIR-NATs (n=630) are more expressed in human brain (log10FPKM) compared to genes with 3’UTR (n=392) or CDS (n=474) overlaps. Box plot: median with upper and lower quartiles; whiskers, values outside of interquartile range; points represent outliers (Welch two-sample t-test; one-way ANOVA across all gene-regions p=0.0214). d, Enriched cellular components and disease GO-terms ranked by Enrichr. 5’UTR-overlapping genes significantly associate with dementia (one-sided Fisher’s exact test p-values combined with z-scores, Supplementary Table 2b). e, MIR-NATs cognate PC-genes sorted by their overlap (3’UTR, 5’UTR, CDS) form networks of interacting proteins (coloured seeds), computed using PINOT29, and are associated with neurodegenerative diseases, enriched within 5’UTR network (p=1.5x10⁻⁴, 100,000 random simulations pnorm) f, PLCG1 and PLCG1-AS genes. g, Immunoblot quantification of SH-SY5Y cells stably expressing empty vector (Empty), full-length (FL) or MIR deleted (ΔM)-PLCG1-AS. PLCG1 is reduced in cells expressing FL but not ΔM-PLCG1-AS (n=6 clones stably expressing each construct, mean ± s.d., one-way ANOVA with Dunnett’s test).

