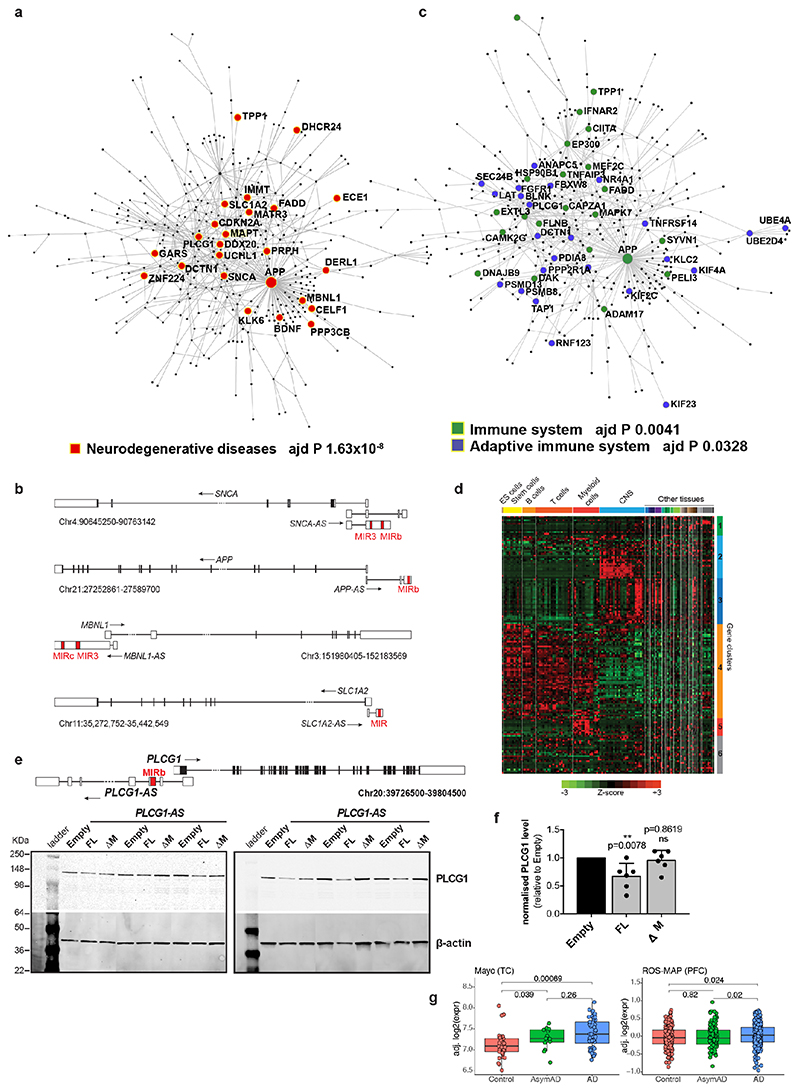
Extended Data Figure 9. Majority of genes targeted by antisense MIR-NATs interact in a PPI network and are enriched for neurodegenerative disease-associated and immune system-associated genes.
(a) Protein-protein interaction (PPI)-network obtained from literature-curated interaction data from InnateDB database, using 392 seed proteins participating in S-AS pairs with MIR-NATs. Genes coding proteins associated with neurodegenerative diseases, represented as red-filled circles, are significantly enriched in network (p=1.63x10⁻⁸, Benjamini-Hochberg FDR using WebGestalt). Only primary interactions are represented in a zerodegree interaction network generated with NetworkAnalyst tool69. Self-interactions are not considered. (b) Schematic structures of representative genes pairing with antisense MIR-NATs and involved in different neurodegenerative diseases. GENCODE v19 annotated isoforms of the human SNCA, APP, MBNL1 and SLC1A2 genes and respective overlapping antisense MIR-NAT. MIR elements within each lncRNA are indicated (red). (c) Protein-protein interaction (PPI)-network obtained from literature-curated interaction data from InnateDB database, using 392 seed proteins participating in S-AS pairs with MIR-NATs. Genes encoding proteins associated with either the immune system (green) or innate immune system (blue), are significantly enriched into the network (respectively p=0.0041, p=0.0328, Benjamini-Hochberg FDR using NetworkAnalyst). Only primary interactions are represented in a zero-degree network generated using NetworkAnalyst tool69. Self-interactions are not considered. (d) Gene expression heatmap for 487 protein-coding genes with 5’-UTR overlapping with antisense MIR-NATs in 126 normal human tissues, from 557 publicly available microarray datasets, retrieved from the Enrichment Profiler Database (http://xavierlab2.mgh.harvard.edu/EnrichmentProfiler/index.html). Genes are clustered on y-axis and tissues are clustered on x-axis. Scale bar at bottom indicates colours associated to each z-score in the expression heatmap. (e) Scheme of the PLCG1 and PLCG1-AS genes is reported (hg19); the inverted MIRb is in red. Immunoblots of 6 independent SH-SY5Y clones stably expressing either empty vector (Empty), PLCG1-AS full-length (FL) or with whole inverted MIRb deleted (ΔM), probed with anti-PLCG1 and β-actin antibodies. (f) PLCG1 protein level is reduced in cells expressing FL- but not ΔM-PLCG1-AS as quantified in the graph (n=6 independent stable SH-SY5Y clones for each construct, mean± s.d., *p<0.05; one-way ANOVA with Dunnett’s test). (g) PLCG1 mRNA expression level from bulk RNA-seq of temporal cortex (TC) and prefrontal cortex (PFC) from the Mayo Clinic (n=160) and ROS-MAP (n=632) datasets respectively, is significantly increased in AD patients (AD) compared to asymptomatic AD (AsymAD) and healthy controls (Control), (box-plots: midpoints, medians; boxes, 25th and 75th percentiles; whiskers, minima and maxima; two-sided Wilcoxon-test) (data from http://swaruplab.bio.uci.edu:3838/bulkRNA/). Control samples were classified as Braak stage 0-I. Early-stage pathology samples were defined as Braak stage II-IV and CERAD score of possible AD, while late-stage pathology samples were Braak stage V-VI and CERAD score of probable and definite AD.

