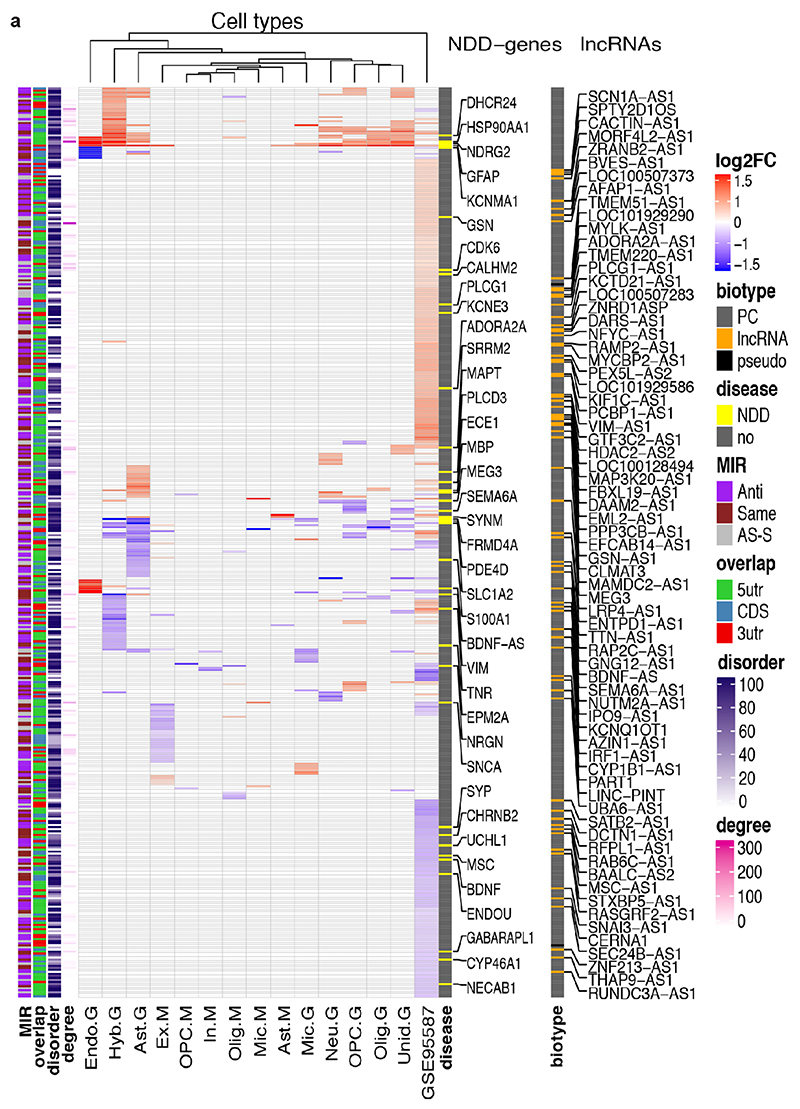
Extended Data Figure 10. 446 genes targeted by MIR-NATs contribute to the transcriptional signature of Alzheimer’s disease.
a, meta-analysis of snRNA-seq from Mathys (M), Grubman (G) and bulk RNA-seq from Friedman (GSE95587) datasets: rows are 446 MIR-NAT differentially expressed genes (DEG): 38 NDD-genes and 69 lncRNAs. DEGs across datasets partially overlap with 65 (27.7% up, 72.3% down) within Mathys, 160 (48.1% up, 51.9% down) within Grubman and 307 (58% up, 42% down) within Friedman datasets. Cell types: excitatory neurons (Ex), inhibitory neurons (In), neurons (Neu), astrocytes (Ast), oligodendrocytes (Olig), oligodendrocyte precursors (OPC), microglia (Mic), hybrid cells (Hyb), endothelial (Endo), unidentified cells (Unid). DEG counts are log2(mean gene expression in AD-pathology/mean gene expression in no-pathology) > 0.25 (two-sided Wilcoxon rank-sum test FDR<0.01 and Poisson mixed-model FDR<0.05, Mathys; two-sided Wilcoxon rank-sum test, FDR<0.05, Grubman and GSE95587). Annotations: gene-type (biotype), NDD-genes in DisGeNET database (disease), MIR orientation (MIR), S-AS region (overlap), percentage of protein IDRs by 75% of D2P2 predictors (disorder), number of protein-protein interactors (degree).

