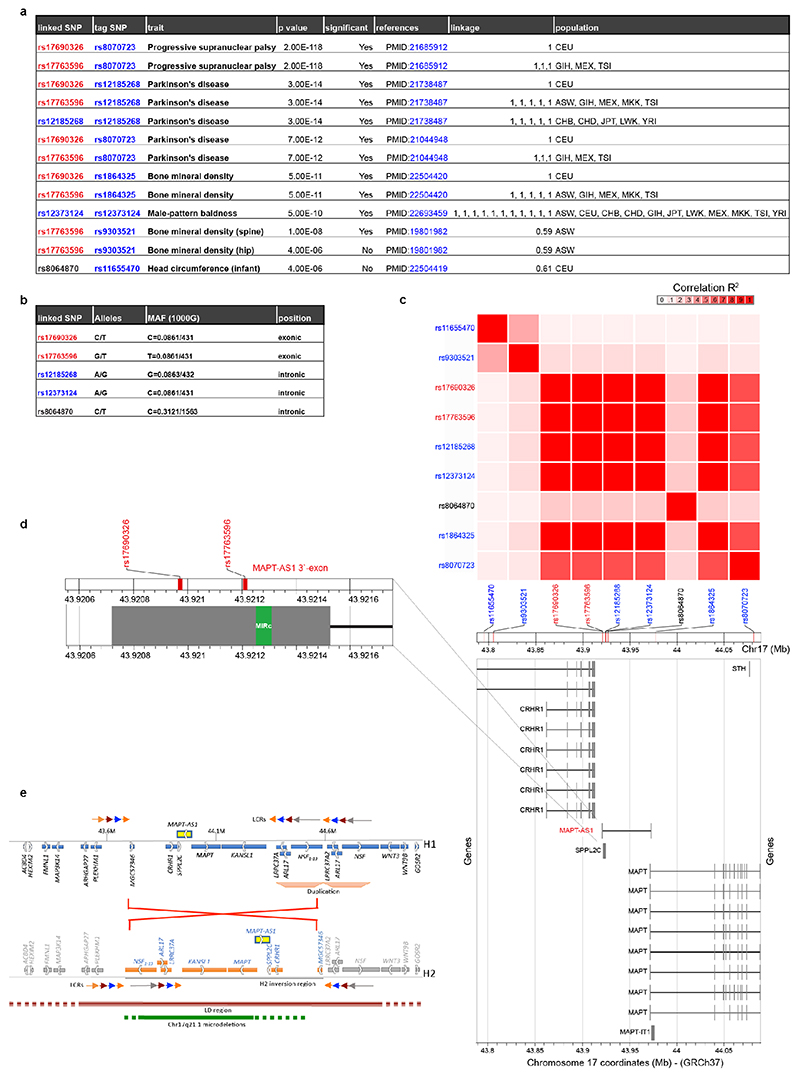
Extended Data Figure 1. Linkage disequilibrium analysis of MAPT-AS1 region.
(a) SNPs within MAPT-AS1 genomic region that are linked (R2≥0.5) to tagging SNPs from the NHGRI GWAS catalog are reported. The specific trait associated to each tagging SNP together with the p-value from the GWAS study and their cited publications PubMed ID are shown. All p-values ≤5x10⁻⁸ were considered to be significant. Linkage disequilibrium (LD) correlations (R2) were calculated using LDlink1.170 for different populations. ASW: Americans of African Ancestry in SW USA; CEU: Utah Residents (CEPH) with Northern and Western European Ancestry; CHB: Han Chinese in Beijing, China; CHD: Chinese in Metropolitan Denver, Colorado; GIH: Gujarati Indians in Houston, Texas; JPT: Japanese in Tokyo, Japan; LWK: Luhya in Webuye, Kenya; MXL: Mexican ancestry in Los Angeles, California; MKK: Maasai in Kinyawa, Kenya; TSI: Toscani in Italy; YRI: Yoruba in Ibadan, Nigeria. (b) For each linked SNP listed in (a), the minor allele frequency (MAF) from the 1000 Genomes Project is given, together with the exon/intron location. (c) Pairwise linkage disequilibrium heatmap created using LDmatrix (https://ldlink.nci.nih.gov/?tab=ldmatrix). Red squares of increasing hue indicate increasing LD correlation between SNPs. A physical map of the genomic region is reported together with annotated RefSeq transcripts for each gene. (d) Enlarged view of the MAPT-AS1 3’-exon (in grey) containing the inverted MIRc element (in green), with two exonic linked SNPs downstream (rs17690326, rs17763596). (e) Detailed scheme of the H1/H2 inversion haplotypes (hg19). All major annotated genes in the linkage disequilibrium (LD) region are coloured in blue for the H1 haplotype, and in orange for the H2 inversion haplotype, with a white arrow representing their relative orientation. Arrays of Low Copy Repeats (LCRs), delimiting the inversion region, are represented by tandem arrows. MAPT-AS1 gene is coloured in yellow.

