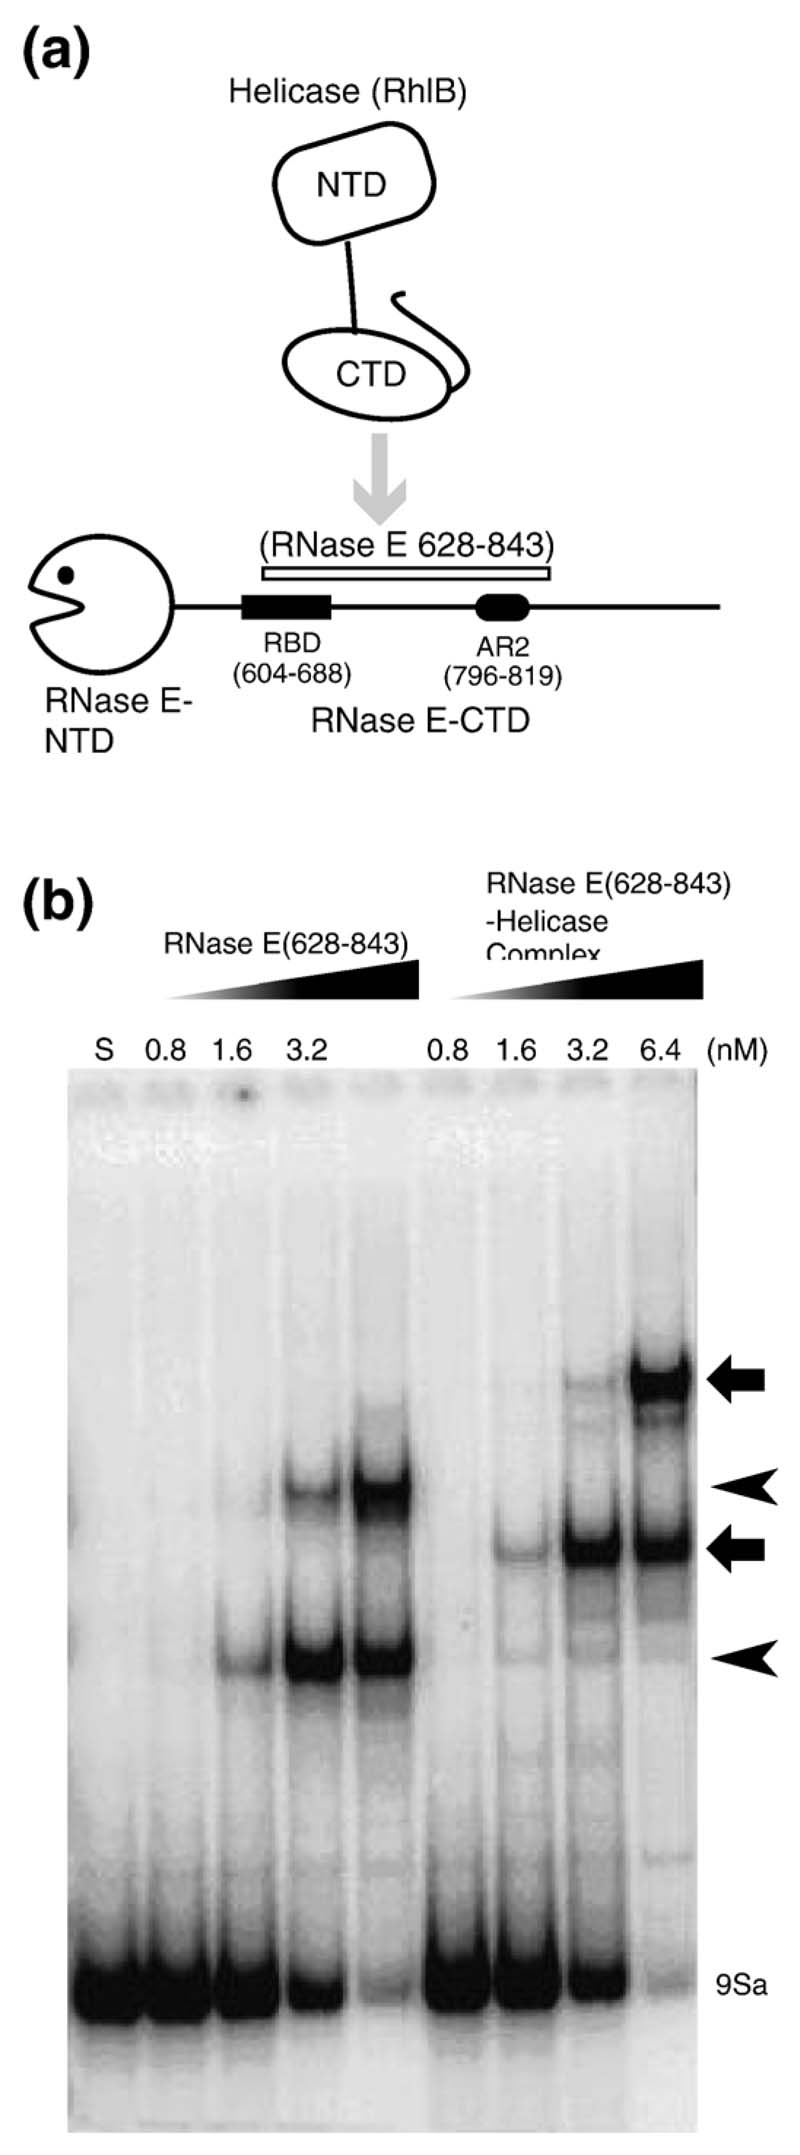
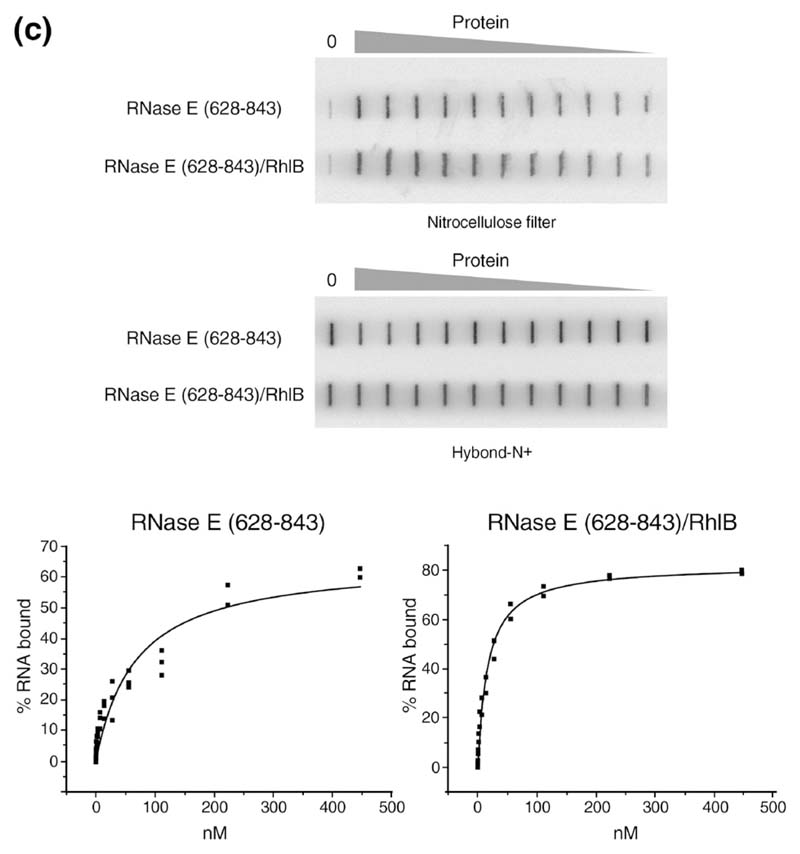
Figure 4. The ternary complex of helicase-RNase E and rRNA.
(a) Schematic representation of the domains used in the experiments. (b) Gel shift assay with RNase E (628–843) alone or complexed with RhlB using the 9Sa RNA substrate. Lane S is the lane for the RNA alone. The free RNA is indicated at the bottom of the gel. The concentrations of the proteins (in nM) are shown above each lane. The shifted bands for the RNase E (628–843)-RNA complex are indicated by arrowheads on the right, and the ternary RNase E (628–843)–helicase–RNA complex are indicated by the broad arrows. (c) Example of a double filter RNA binding assay showing a side-by-side measurement using RNase E (628-843) alone or complexed with RhlB. Quantification of the radioactive RNA on the filters and curve fitting were performed as described in Materials and Methods. The binding isotherms shown here were fitted to data from several independent determinations (see Table 1).


