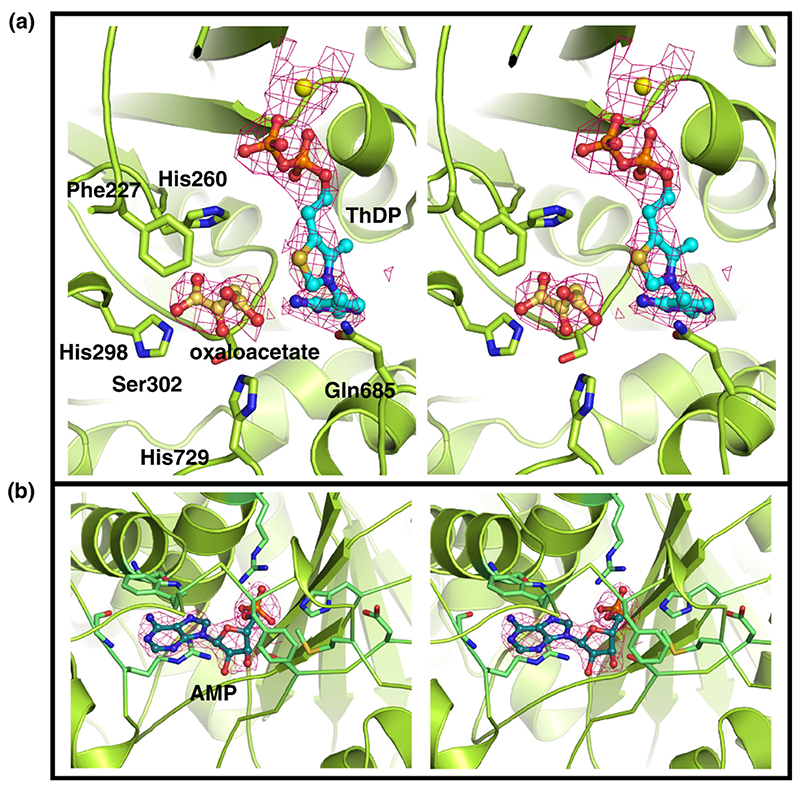
Figure 3. Stereo views of the electron density of putative ligands; the map was generated with sigmaA-weighted coefficients and contoured to 1σ.
(a) Active site of E1o showing Mg2+, ThDP and an oxaloacetate molecule bound (yellow sphere, cyan and gold stick format, respectively). This structure represents E1o in an inhibited conformation as oxaloacetate occludes the site where the substrate is expected to bind. The residues mediating the interactions with oxaloacetate are shown in stick format. (b) AMP binding pocket of E1o.

