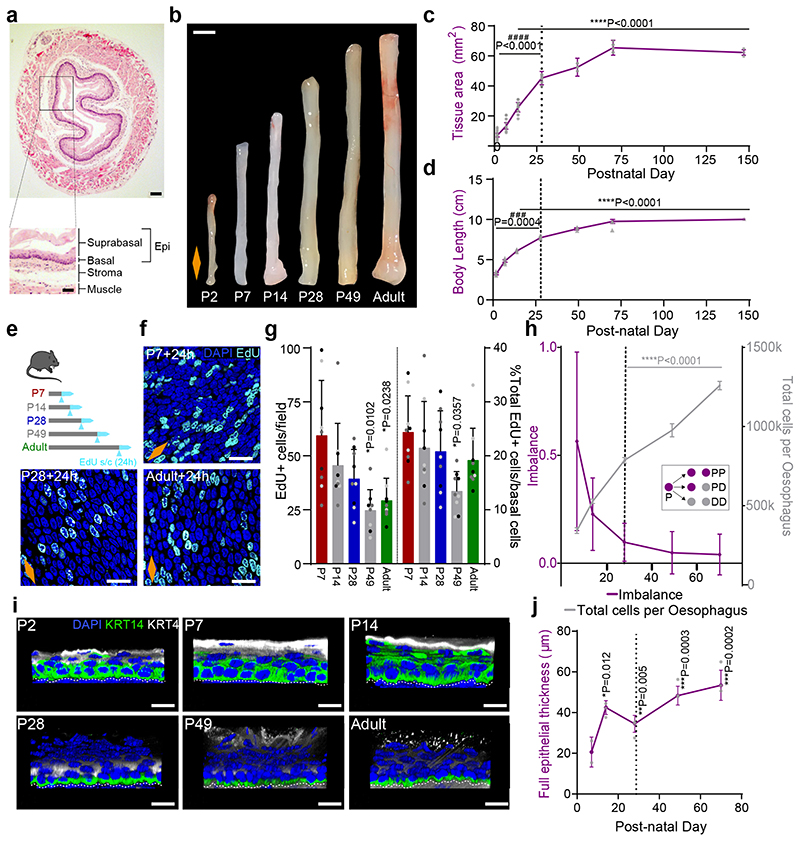
Fig. 1. The postnatal mouse oesophagus as a model of rapid tissue expansion transitioning towards homeostasis.
a, H&E section of adult oesophagus. Inset showing tissue layers. Epi, epithelium.
b, Images of whole oesophagus throughout postnatal development.
c, Tissue area after longitudinally opening the oesophageal tube. n=103 mice; Millimeters, mm.
d, Whole body growth in length excluding tail. n=26 mice; Centimeter, cm.
e, In vivo protocol. Mice were treated with a single EdU injection 24h prior tissue collection at the time points indicated.
f, Basal confocal view of EdU+ cells in typical OE wholemounts from (e).
g, Quantification of EdU+ basal cells per field (left), and relative to the number of DAPI+ basal cells (right) from (e). Presented as mean ± SD. Points show individual measurements, greyscale indicates values from each of 3 mice. n=3 mice.
h, Fraction of cell fate imbalance, showing the degree to which basal cell fate is biased towards duplication over differentiation and loss (left axis; see Methods and model in Fig. 2n). Total cell production throughout postnatal development (right axis; see Methods). Over time OE cells tilt towards balanced cell fate, in line with model of oesophageal homeostasis by Doupe et. al.15 (inset; P, progenitor cell; D, differentiating cell). n=3 mice. See Supplementary Note 1.
i, Representative 3D rendered confocal z-stacks showing side views of OE wholemounts throughout postnatal development.
j, Epithelial thickness, including enucleated terminally differentiated layers. n=3 mice; Micrometre, μm.
All data derived from wild-type C57BL/6J mice, expressed as mean values ± SEM, unless otherwise stated. Data analysis was performed using one-way ANOVA with Tukey’s multiple comparisons test (#p relative to P70; *p relative to P7).
Scale bars. 1a(200 μm), inset(100 μm); 1b(2mm); 1f,i(20μm).
Stainings. Blue, 4’,6-diamidino-2-phenylindole (DAPI); cyan, EdU; green, basal marker KRT14; greyscale, differentiation marker KRT4.
Dashed lines indicate basement membrane. Dotted lines in graphs indicate P28. Orange diamonds depict the longitudinal orientation of the oesophagus where indicated (outlined in Extended Data Fig. 1a). Parts of (e) were drawn by using and/or adapting diagrams from Servier Medical Art.
Source data are provided. See also Extended Data Fig. 1.

