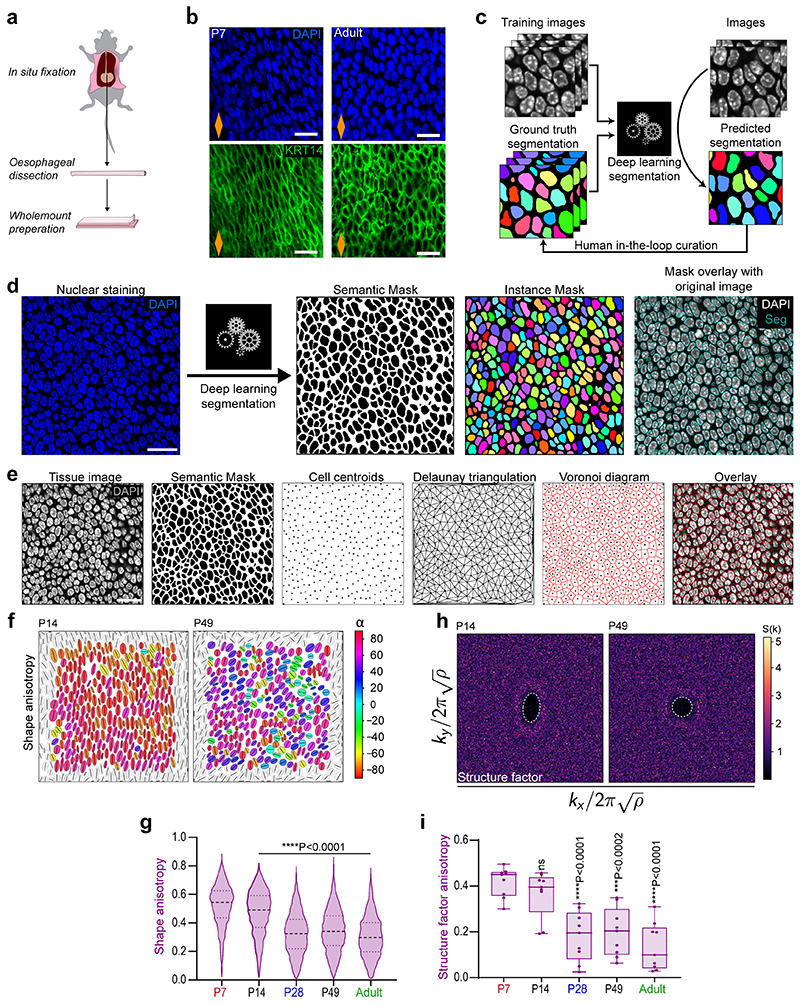
Extended Data Fig. 5. Deep Learning based segmentation. Related to Fig. 4.
a, Protocol for in situ fixation of the oesophagus, and b, Images from in situ oesophagi compared with oesophagi fixed immediately after dissection confirm that basal cell shape was not affected by tissue harvesting (Supplementary to Fig. 4a). Blue, DAPI; green, KRT14. Scale bar, 20 µm. c, Schematic depicting deep learning based segmentation principle. Manually or semi-automatically annotated “ground truth” images were used to train a U-Net convolutional neural network. Training of the network was assessed on validation images and iteratively optimized until the achievement of satisfactory automated segmentation. d, Schematic of pipeline utilised for segmentation of single z-slice confocal images of OE basal layer. Nuclear segmentation was based on DAPI staining (blue). Mask overlay shows the match between the binary mask and the original fluorescence image. Scale bar, 20 µm. e, Schematic describing the computation of Voronoi diagrams of the tissue. Single z-slice confocal images of the OE basal layer are segmented as described in (d). Cell centroids are computed using the binary mask. Delaunay triangulation of cells was performed using cell centroids coordinates. Voronoi diagrams are calculated as the dual of Delaunay triangulation of cells in the tissue and overlaid onto the original fluorescence image. Scale bar, 20 µm. f, Cell shape anisotropy tensor at P14 and P49 (supplementary to Fig. 4d). n=3 mice. Orientation is colour-coded. Results from a representative experiment are shown; n=3 mice. g, Violin plots showing the distribution in cell shape anisotropy throughout postnatal development. n=2052-2594 cells from 3 animals per time point. Black dashed line, median. One-way ANOVA with Tukey’s multiple comparisons test (*p relative to P7). h, Bidimensional structure factor at P14 and P49 (supplementary to Fig. 4e). Changes in the dashed white outline (from ellipse to circle) depict a transition from anisotropic to isotropic spatial distribution over time; n=3 mice. i, Structure factor shape anisotropy distribution as shown in (h) and Fig. 4e. Box plots show median and quartiles; and whiskers, minima/maxima. Individual measurements from n=3 mice; (ns, not significant; *p relative to P7).
All data derived from wild-type C57BL/6J mice. Parts of (a) were drawn by using and/or adapting diagrams from Servier Medical Art.
Source data are provided.

