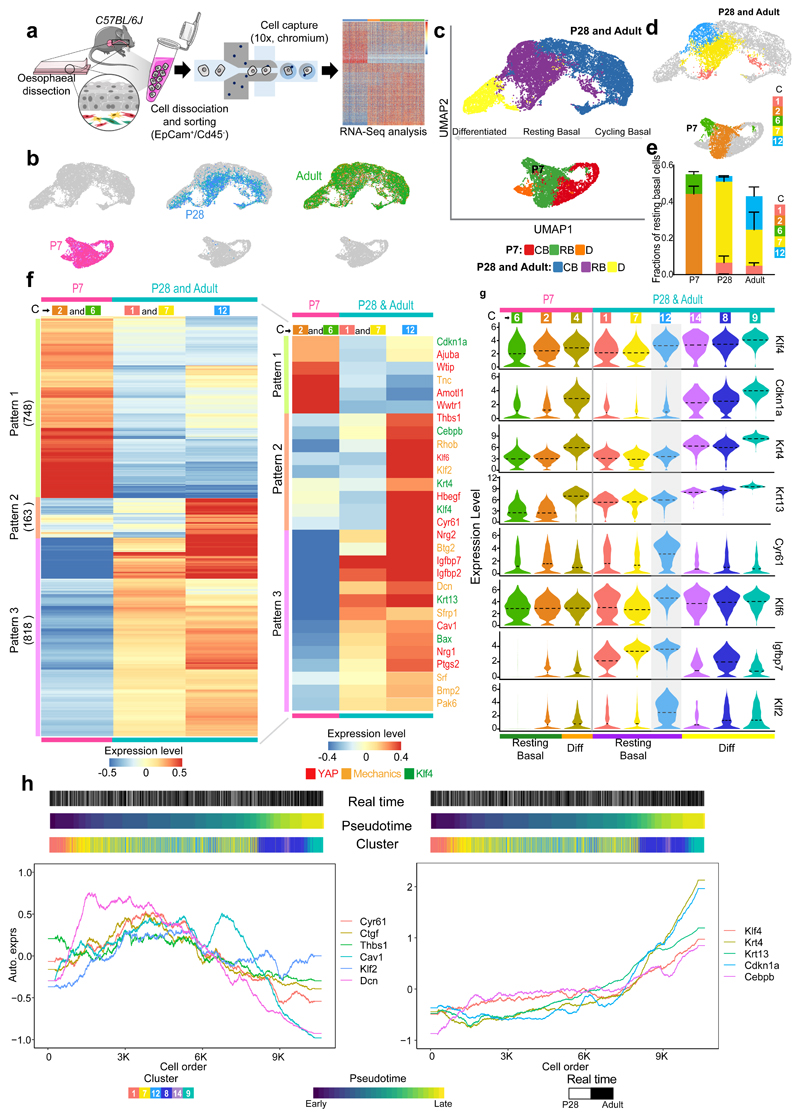
Fig. 3. Single-cell transcriptional profiling defines transition towards homeostasis.
a, Schematic of single-cell RNA-seq data generation from OE sorted cells (EpCam+/Cd45-) using 10X Genomics platform. Cells were isolated form 15 mice (P7), 12 mice (P28), and 9 (adults); 3 libraries (x10, Chromium) for P7 and P28, and 6 libraries for Adult.
b, Cell distribution in the dimension reduction space UMAP at different postnatal time points.
c, UMAPs representing annotated cell types. CB, cycling basal; RB, resting basal; D, differentiated.
d, UMAPs representing resting basal cell clusters from Extended Data Fig. 3b.
e, Fraction of resting basal cell clusters per time point. Fraction, expressed as mean values ± SEM. n=3 for P7 and P28 and n=6 for Adult.
f, Heatmap representing expression of individual genes belonging to distinctive patterns of gene expression in resting basal cells as defined in (c) and (d), number of genes provided in brackets. For expression values, log2-transformed normalized UMIs were scaled and averaged across all cells belonging to each group of resting basal cell cluster(s). Scale bar denotes expression range. Inset shows the expression of selected genes related to KLF4, YAP and response to mechanical stimuli. The colours of gene names denotes the relevancy to KLF4, YAP and response to mechanical stimuli.
g, Violin plots showing the expression distribution from resting basal through to differentiated clusters of selected genes in (f) related to KLF4 and tissue mechanics. The expression is log2-transformed normalized UMIs. Dotted lines, mean.
h, Expression of relevant genes along the pseudotime trajectory from resting basal to differentiated cells for P28 and Adult. Left panel, YAP target genes (Cyr61, Ctgf, Thbs1) and genes associated with a response to mechanical stimuli (Cav1, Klf2, Dcn). Right panel, depicts KLF4 target genes (Krt4, Krt13, Cdnk1a, Cebpb). Gene expression is represented as auto-scaled, log2-transformed normalized UMIs smoothed using a rolling mean along its trajectory with a window size of 5% of cells. The three bars on the top denote the arrangement of cells according to real time points, pseudotime and clusters in Extended Data Fig. 3b, respectively.
C, Cluster. Parts of (a) were drawn by using and/or adapting diagrams from Servier Medical Art.
See also Extended Data Fig. 3,4.

