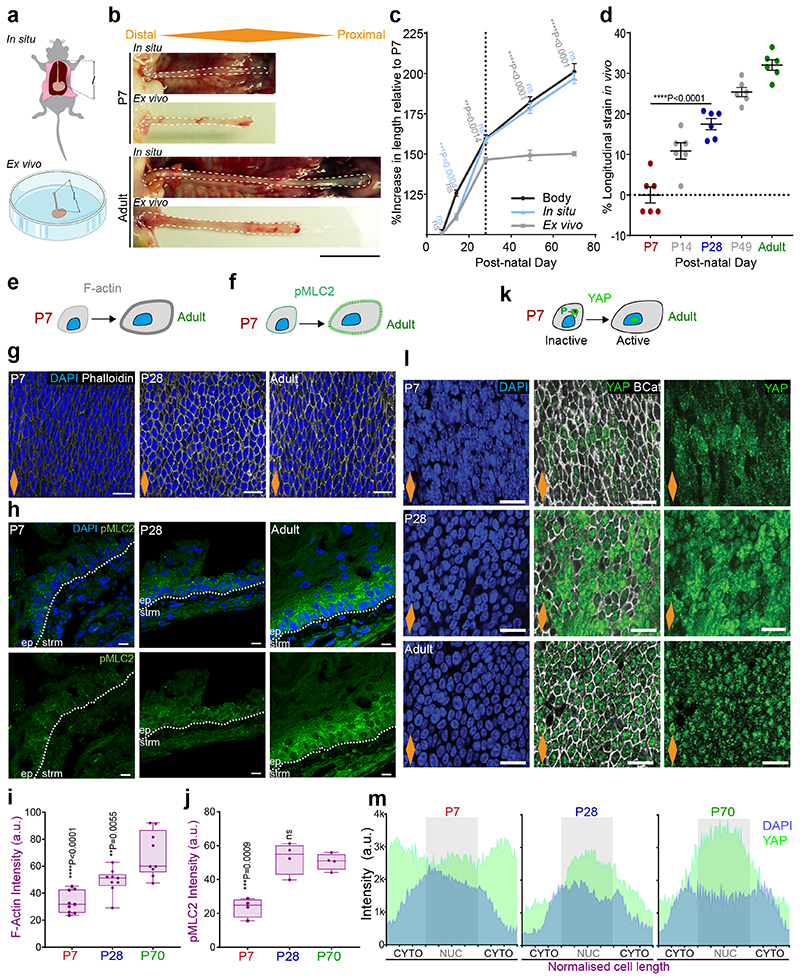
Fig. 5. Differential growth generates longitudinal tissue strain sensed at the cellular level.
a, Method for oesophageal length measurements in situ and ex vivo (l).
b, In situ and immediate ex vivo images of oesophageal tubes captured in P7 and adult mice. Dashed lines delineate oesophageal tube.
c, Percentage increase in oesophageal length (in situ and ex vivo) compared to body length (excluding tail) throughout postnatal development (P7 set to 100). Dashed line indicates P28. Data expressed as mean ± SEM. Each time point was analysed using two tailed unpaired t-test (ns, not significant; grey and blue indicate difference between body and ex vivo, body and in vivo, respectively.); n=6 mice.
d, Longitudinal tissue strain in vivo represented as percentage. Data expressed as mean ± SEM; n=6 mice.
e and f, Schematic representing changes in F-actin (grey) and pMLC2 (green) levels in OE cells throughout postnatal development.
g, Basal views of typical OE wholemount showing Phalloidin staining for F-actin at indicated time points. Blue, DAPI; greyscale, Phalloidin.
h, Representative side views of tissue sections showing pMLC2 staining at indicated time points. Blue, DAPI; green, pMLC2; Dotted lines, basement membrane; ep, epithelium; strm, stroma.
i and j, Quantification of basal F-actin and pMLC2 staining, respectively (see Methods). Box plots show median and quartiles; and whiskers, minima/maxima; (i) n=3 animals, (j) n=4 mice.
k, Schematic representation of changes in YAP (green) localization during postnatal development.
l, Basal view of representative OE wholemounts showing progressive translocation of YAP to the nucleus as tissue matures. Blue, DAPI; green, YAP; greyscale, B-Catenin (BCat).
m, Quantification of basal nuclear and cytoplasmic YAP staining (see Methods). A total of 60 cells per time point were measured from 3 animals. Localization pattern shows the average intensity for one representative animal per time point. Full quantification in Extended Data Fig. 6 j, k.
Scale bars. 5b(1 cm); 5g,l(20 μm); 5h (10 μm).
Data analysis for d, i, and j was performed using one-way ANOVA with Tukey’s multiple comparisons test (*p; relative to P7; ns, not significant).
Orange diamonds, longitudinal orientation of the oesophagus (Extended Data Fig. 1a). Parts of (a) were drawn by using and/or adapting diagrams from Servier Medical Art.
Source data are provided. See also Supplementary Note 1 and Extended Data Fig. 6.

