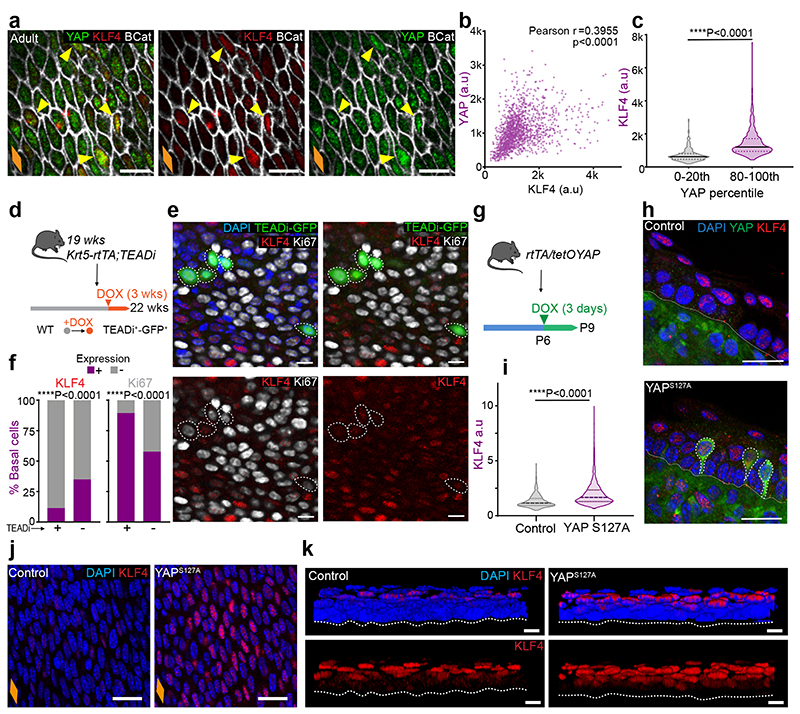
Fig. 6. YAP nuclear localization promotes increased levels of basal commitment through KLF4.
a, Confocal basal views of typical adult OE from C57BL/6J WT mice. Yellow arrows indicate colocalization of KLF4 (high) and YAP (high) staining.
b, Correlation plot for KLF4 and YAP intensities in the basal layer the adult OE (a). n=3 mice. (r, Pearson correlation coefficient)
c, Quantification of KLF4 intensity (a.u) within the lowest and highest YAP expressing cells (0-20th and 80-100th percentile respectively). n=296 cells per percentile from 3 mice.
d, In vivo protocol. Adult Krt5-rtTA;TEADi mice were doxycycline (DOX) treated for 3 weeks to block YAP and TAZ-induced TEAD activity in basal cells. TEADi expressing cells are marked by GFP expression (TEADi+).
e, Representative basal views of OE wholemounts from (d). TEADi expressing cells are marked by GFP expression. Dotted circles indicate GFP+ cells.
f, Percentage of KLF4+/- and Ki67+/- cells in TEADi+/- basal cells from (d, as marked by GFP). A total of 800 TEADi+/-basal cells were quantified from 72 fields out of 2 mice. Analysed by one sided Chi-squared test.
g, In vivo protocol. P6 rtTA/tetOYAP pups were doxycycline treated for 3 days to induce an active form of YAP (S127A), and culled at P9.
h, Staining in OCT embedded OE cryosections (10 μm thick) of YAP activated mice from (g). Nuclear KLF4 expression colocalizes with YAP+ cells. Dotted white lines, YAP+ cells.
i, KLF4 intensity quantification (a.u) in control and YAP overexpressing mice as shown in (j). n=1362-1779 cells from 3 animals.
j, Representative basal views of OE wholemounts from (g).
k, Representative 3D rendered side views of OE wholemounts from (g), showing expanded KLF4 suprabasal compartment in rtTA/tetOYAP mice compared to controls.
Scale bars. 6a,e and k(10 μm), 6h,j(20μm).
Stainings. Blue, DAPI. 6A, 6H, 6J, 6K (green, YAP; red, KLF4; greyscale, BCat). 6A (green, TEADi; red, KLF4; greyscale, Ki67)
Dotted line, basement membrane (h, k). Violin plots (c, i) show median (solid line) and quartiles (dotted lines). Data from (c) and (i) were analysed using two-tailed unpaired t test.
Orange diamonds depict the longitudinal orientation of the oesophagus where indicated (outlined in Extended Data Fig. 1a). Parts of (d, g) were drawn by using and/or adapting diagrams from Servier Medical Art.
Source data are provided. See also Supplementary Note 1.

