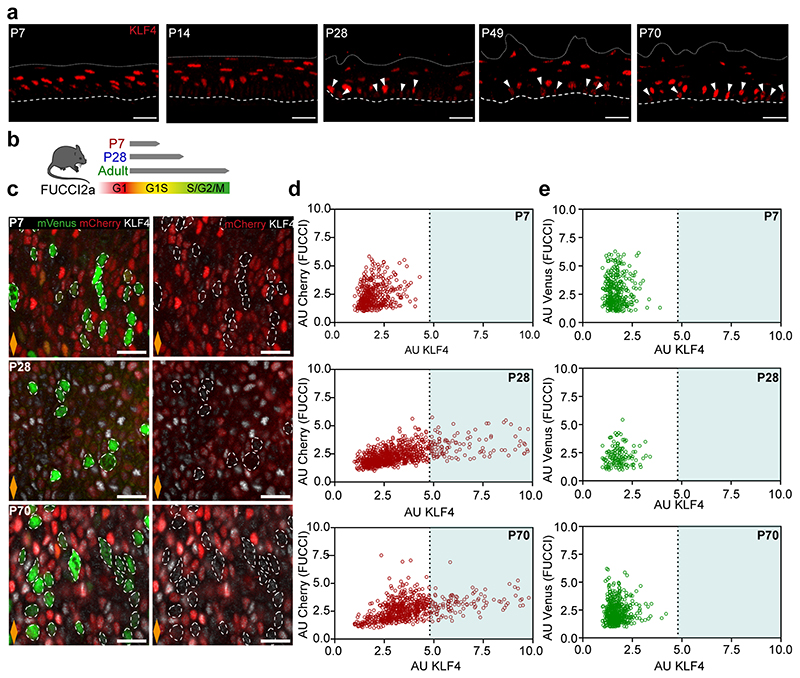
Extended Data Fig. 2. KLF4 basal cell profile in FUCCI2a mice. Related to Fig. 2.
a, Representative confocal z-stacks showing side views of OE wholemounts from Fig. 2a. Dashed lines indicate basement membrane; dotted lines mark the upper limit of the OE; white arrows indicate basal KLF4+ cells. Red, KLF4. b, In vivo protocol. Oesophagi from FUCCI2a mice were collected at time points indicated. Schematic indicating expression pattern of fluorescent proteins in FUCCI2a mouse model. c, Confocal images showing basal views of typical FUCCI2a OE wholemounts in (b). Orange diamonds indicate longitudinal orientation of the oesophagus. White dashed lines indicate mVenus+ cells; green, mVenus; red, mCherry. d and e, Correlation between KLF4 protein expression and reporter fluorescent proteins mCherry (d)/mVenus (e) in the basal layer from (b) and (c). n=3 mice; Scale bars 20 µm. Parts of (b) were drawn by using and/or adapting diagrams from Servier Medical Art.
Source data are provided.

