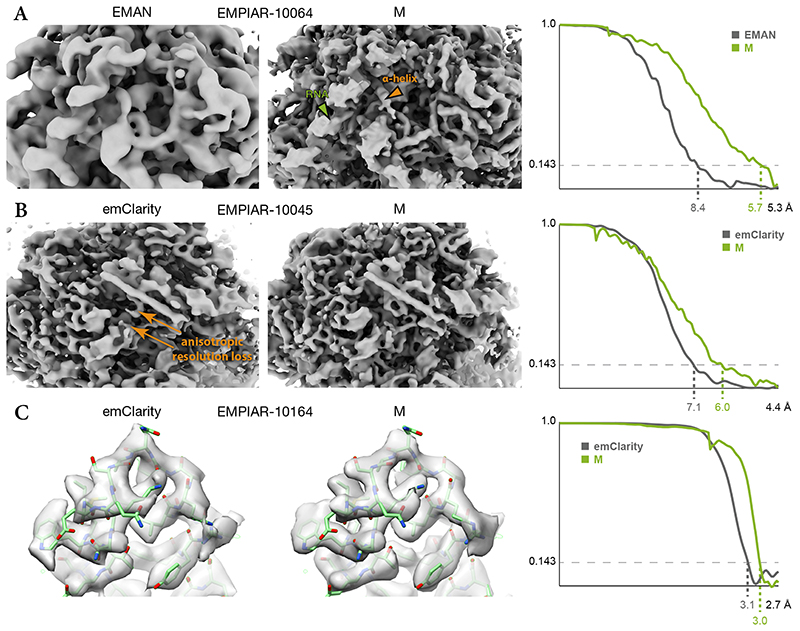
Figure 6. Comparison of maps obtained from published tilt-series using M or other software.
(a) 80S ribosome data from EMPIAR-10064 were used to benchmark tilt-series processing in EMAN (EMD-0529). M achieved higher resolution, accompanied by visibly better resolved features such as RNA (green arrow) and α-helices (orange arrow).
(b) 80S ribosome data from EMPIAR-10045 were used to benchmark emClarity. The originally published map (EMD-8799, not shown) exhibited strong resolution anisotropy. A recently updated map42 still suffered from resolution anisotropy (“smearing” direction indicated by orange arrows). M achieved higher and more isotropic resolution, aiding the map’s interpretability.
(c) HIV-1 capsid-SP1 data from EMPIAR-10164 were used to benchmark emClarity (EMD-8986). M achieved slightly higher resolution using ca. 30% of the particle number used by emClarity. Doubling the number of particles did not increase the resolution. PDB-5L93 was rigid-body fitted into the maps for visualization.

