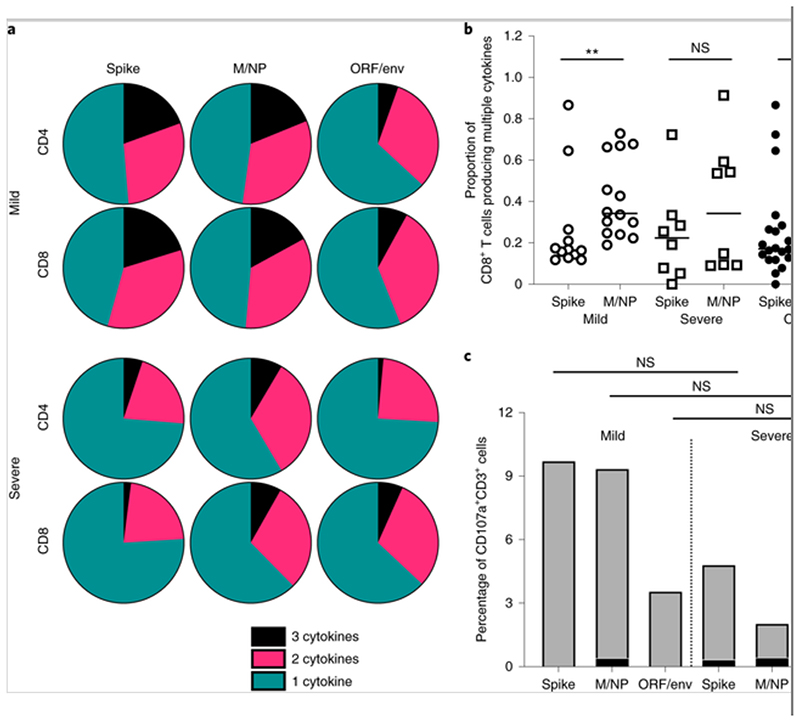
Fig. 5. Cytokine profile of SARS-Cov-2-specific T cells.
The cytokine production of SARS-Cov-2-specific T cells was assessed by ICS after incubation with SARS-CoV-2 peptides. a, Pie charts representing the relative proportions of spike-, M/NP- and ORF/env-specific CD4+ and CD8+ T cells producing one (green), two (pink) or three cytokines (black) (out of IFN-γ, TNF and IL-2). b, Comparison of the frequency of multifunctional CD8+ T cells targeting spike and M/NP. The open circles and squares represent T cell responses in mild cases and severe cases, respectively. P values are as follows: P = 0.0037 (mild); P = 0.3823 (severe); P = 0.0231 (overall). c, Relative frequencies of CD4+ and CD8+ T cells expressing CD107a after antigen stimulation. The data shown are from 14 patients with mild symptoms and eight patients with severe symptoms. The Mann–Whitney U-test was used for the analysis. Two-tailed P values were calculated. *P < 0.05; **P < 0.01.

