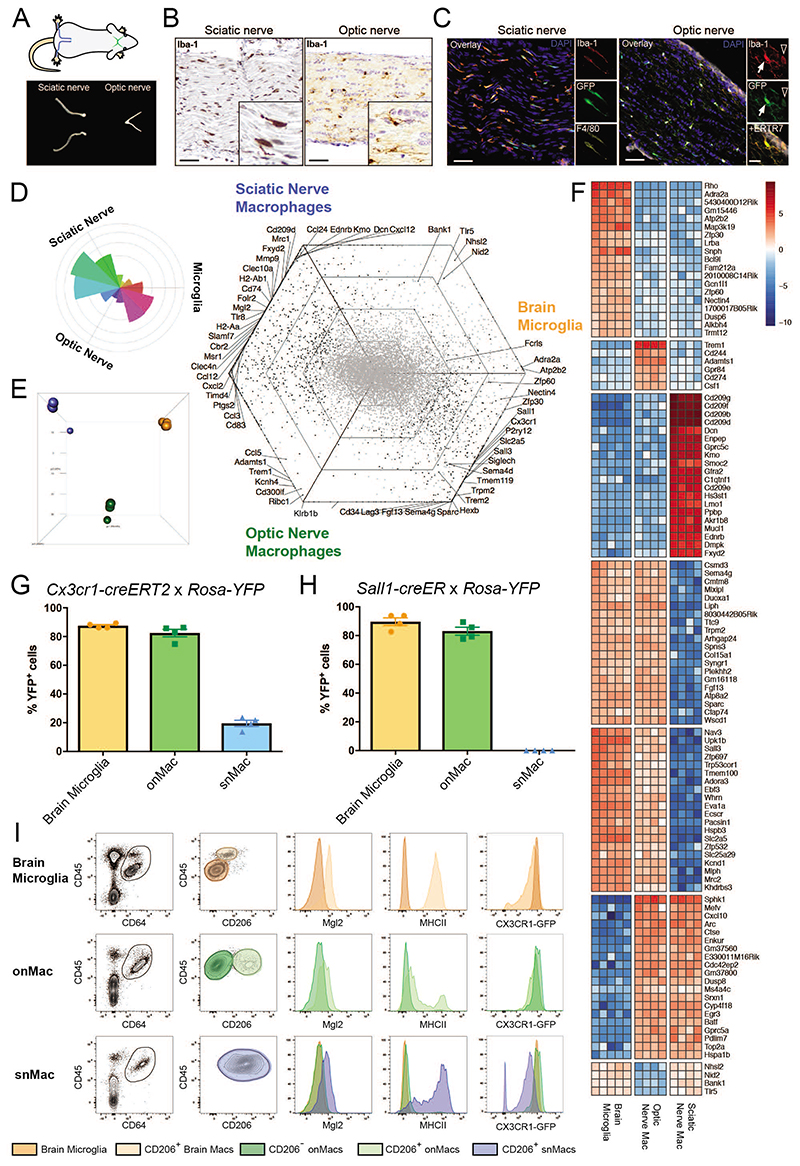
Figure 2. Optic nerve macrophages are closer to brain microglia than snMacs.
A. Scheme of sciatic nerves (blue) and optic nerves (green) and representative pictures of isolated nerves. B. Light microscopy images showing Iba1+ macrophages (brown) in sciatic nerve and optic nerve. Scale bar, 50μm. C. Immunofluorescence microscopy images showing Iba1+F4/80+Cx3cr1gfp+ sciatic nerve macrophages and Iba1+Cx3cr1gfp+ optic nerve macrophages both inside the optic nerve (arrow) and within the surrounding ERTR7+ meninges (arrowhead). Scale bar, 50μm, insets 20μm. D. Rose and hexagon “triwise” plots of genes detected by bulk RNA sequencing in snMacs, onMacs and brain microglia. snMacs were sorted as CD45+F4/80+CD64+ live cells, onMacs and microglia were sorted as CD45LoCD11bhi live cells. E. Principle component analysis (PCA) of the bulk RNA-sequencing transcriptome profiles. Sciatic nerve macrophages in blue, optic nerve macrophages in green and brain microglia in orange. F. Heatmap of the top genes differentially expressed or shared between the brain microglia, optic nerve macrophages or sciatic nerve macrophages. The heatmap displays the relative log2 normalized expression per gene. This was determined by calculating the mean expression value per gene over all cell types in the heatmap and then subtracting this mean from each cell type’s particular gene expression value. G, H. Adult Cx3cr1creER:R26-YFP (G) or Sall1creER:R26-YFP (H), were injected with TAM and YFP expression was analyzed after two weeks by flow cytometry. Each symbol represents one mouse. I. Expression of CD206, CD45, Mgl2, MHCII and CX3CR1-GFP by CD45+CD64+ macrophages measured by flow cytometry. Plots are depicting CD206- brain microglia (orange) and CD206+ brain macrophages (light orange) as well as CD206- (green) and CD206+ (light green) onMacs. Sciatic nerve macrophages (blue). Histograms show the expression levels of MGL2, MHCII and Cx3cr1-GFP in the individual populations. Each histogram comes from four pooled mice. (B, C) Representative data from two independent microscopy or flow cytometry experiments. (D, E, F) Bulk RNA-sequencing data were obtained from four to five independent replicates from at least three different experiments. For snMacs and onMacs, cells from five mice were pooled per replicate. (G, H) Pooled data coming from 2 independent experiments (4 mice in total). (I) Representative data from two independent flow cytometry experiments. The gating strategy for sorting snMacs is depicted in Supplementary Figure 1B.

