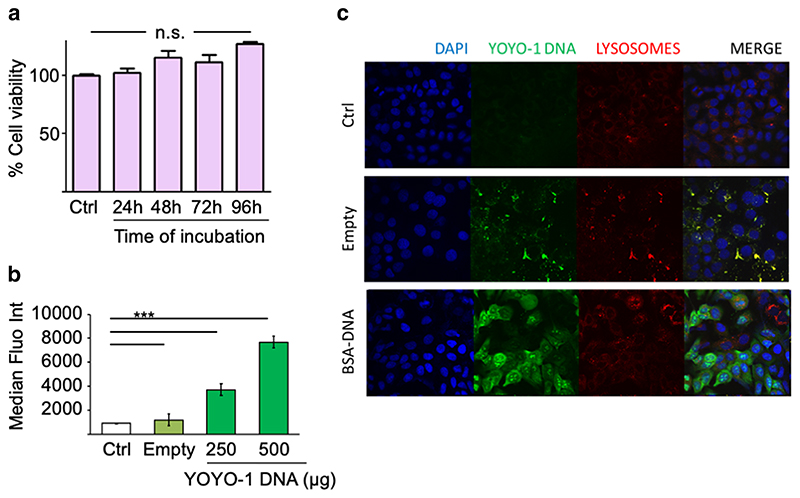
Fig. 4. BSA nanoparticles can safely and efficiently deliver DNA to A549 cells.
(a) Cell viability (% Y-axis) as measured by MTS assay in A549 cells treated with 200 μg of BSA nanoparticles for 24, 48, 72 and 96 h (Time, X-axis). (b) Transfection of A549 cells with BSA nanoparticles loaded with a YOYO-1 labelled DNA measured by flow cytometry as median fluorescence intensity (MFI, Y-axis). μg DNA is DNA amount used for transfection, taking into account encapsulation efficiency for each preparation. (c) Confocal images of A549 cells 24 h after transfecting with BSA nanoparticles loaded with YOYO-1 labelled DNA (green) and staining with DAPI (blue, depicting the cell nuclei) and LysoTracker Red DND-99(red, representing the lysosomes). Empty nanoparticles exhibit auto fluorescence on excitation at 488 nm. Ctrl, untreated cells. Data points indicate mean ± SD, n = 3; One-way ANOVA, ***, p < 0.001; ns, not significant.

