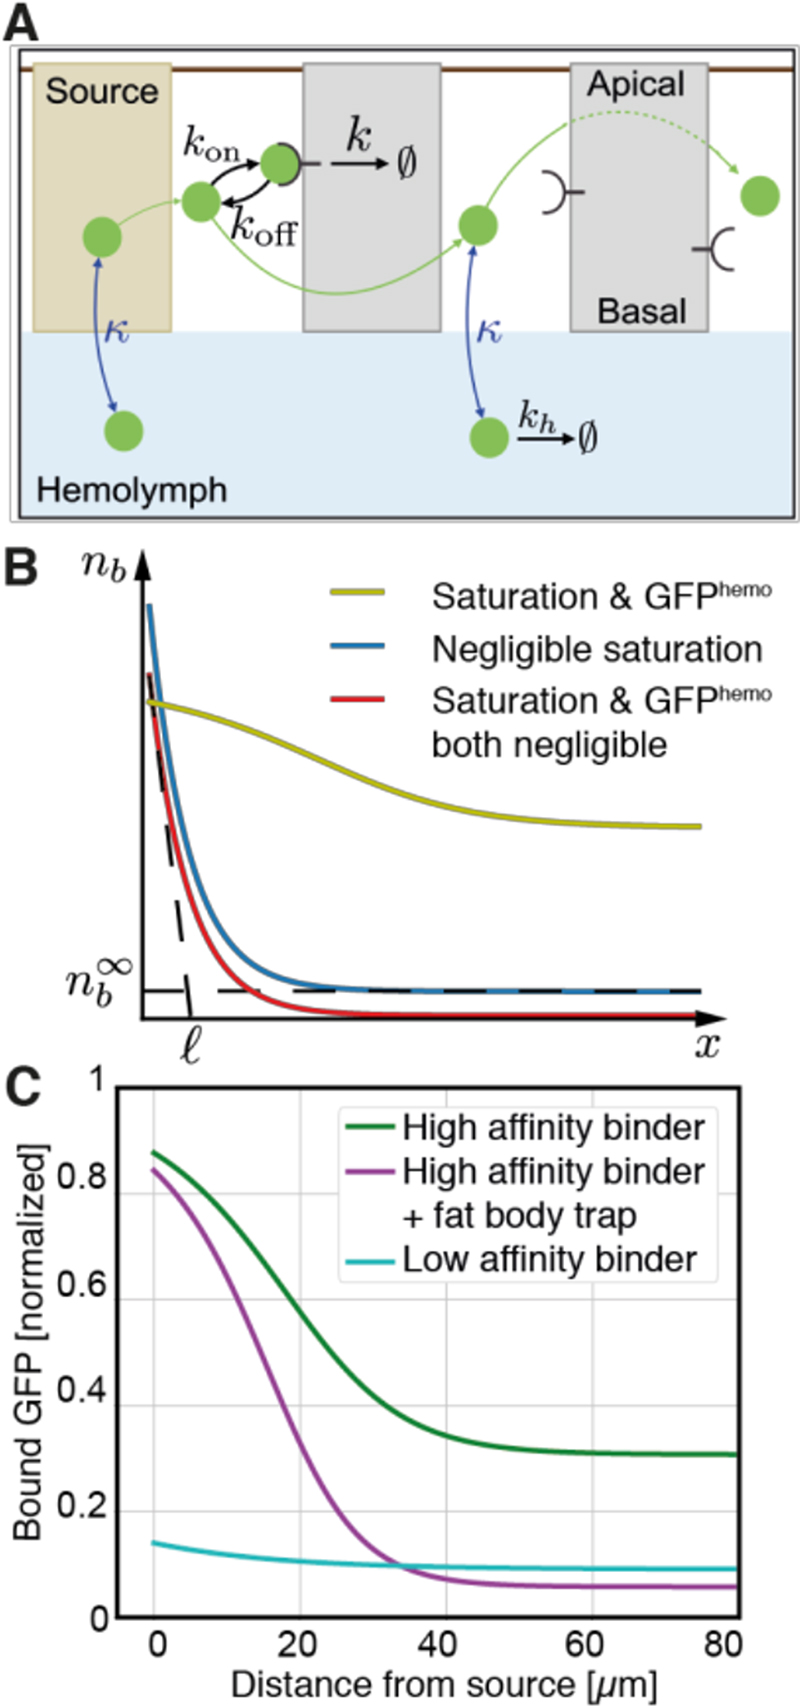
Fig. 2. A diffusion-degradation-leakage model for GFP gradient formation.
(A) Schematic representation of the model for gradient formation. Parameters are described in the main text and Supplementary Theory. (B) Main features of bound GFP profiles predicted by the model using parameters listed in Table S2 (unless specified otherwise). Yellow-green curve: Profile exhibiting receptor saturation near the source, and a non-zero tail due to GFPhemo (ligand production rate j = 0.5nM/s, n T = 100nM. μm). Blue curve: Without saturation, the gradient is an exponential with a non-zero tail and a decay length that depends on diffusion, effective degradation with rate k r and leakage with rate K (j = 3. 10−4nM/s, n T = 3. 104 nM. μm). Red curve: Setting the ligand concentration to zero in the hemolymph abolishes the non-zero tail (as blue curve with c H =0). See section 1.3 of the Supplementary Theory for full parameter definitions. (C) Bound GFP profiles normalized to the total concentration of receptors. The blue and green curves were obtained with the known on and off rates for the low- and high-affinity receptors respectively. The purple curve was obtained by increasing degradation in the hemolymph. Compare to corresponding experimental curves in Fig. 1D.

