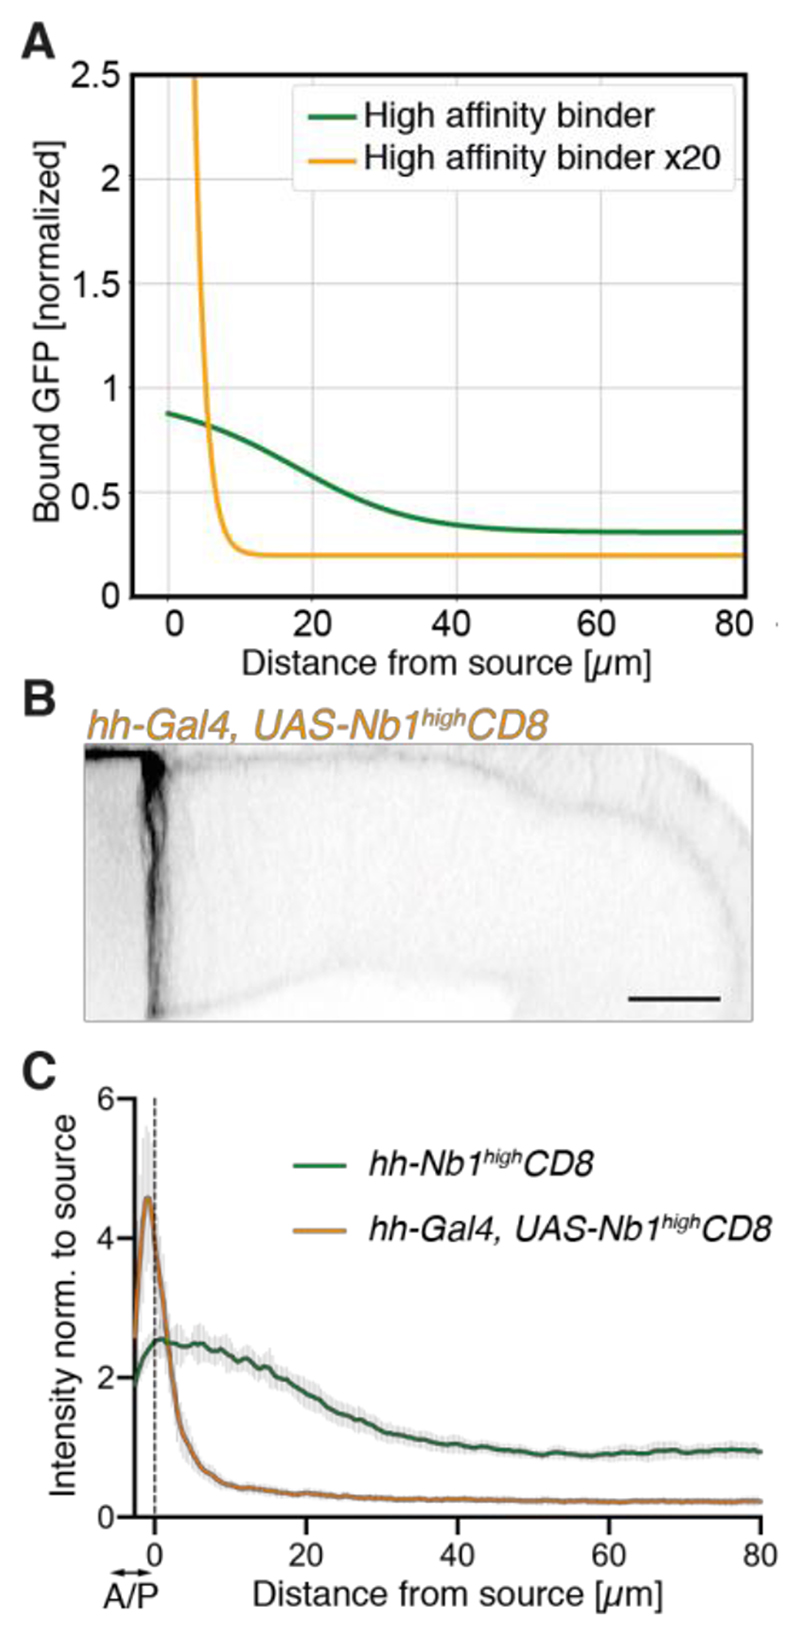
Fig. 3. Predicted and experimental effect of increasing binder expression.
(A) Predicted GFP profile following a 20-fold increase in binder expression (orange). Compare to green curve, which is reproduced from Fig. 2C. Note the steep gradient and the lower non-zero tail. Bound-GFP concentrations are normalized to the lower value of total receptor concentration. (B) Cross-section of a ptc-SecGFP imaginal disc overexpressing the high-affinity binder (hh- Gal4, UAS-Nb1highCD8). (C) GFP profiles in hh-Gal4, UAS-Nb1highCD8 (orange curve, n=8) and hh-Nb1highCD8 discs (green curve from Fig. 1D). Scale bars: 20 μm

