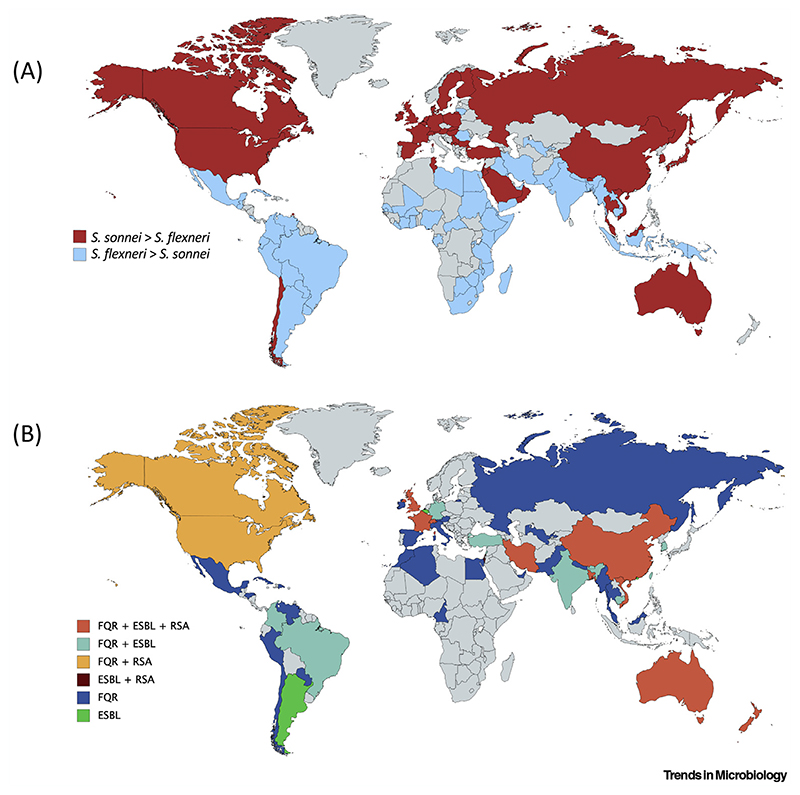
Figure 1. Epidemiology of Shigella sonnei.
(A) Cases of S. sonnei versus Shigella flexneri. Cases of S. sonnei are increasing globally. Red indicates countries where S. sonnei is the dominant cause of shigellosis (when compared with S. flexneri). Blue indicates countries where a higher proportion of S. flexneri is still being reported (although S. sonnei cases may be rapidly increasing). Data presented according to Thompson et al. (see Literature). (B) Distribution of S. sonnei resistance to first- and second-line antibiotics. FQR, fluoroquinolone resistance; ESBL, extended-spectrum β-lactamase-producing (i.e., resistant to third-generation cephalosporins or carbapenems); RSA, reduced sensitivity to azithromycin. Countries are colored according to antibiotic-resistant cases reported in Table S1 in the supplemental information online.

