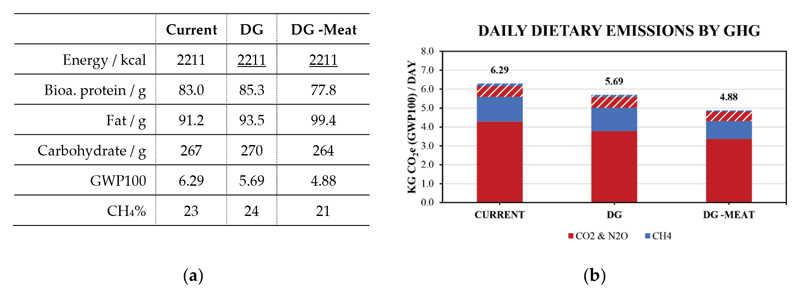
Figure 2.
Estimated daily dietary emissions for the reference ‘Current’ diet and the hypothetical ‘DG’, ‘DG -Meat’ by energy compensation. Emissions are allocated by emissions due to consumption (solid areas) and emissions due to waste (dashed areas) while the colours differentiate emissions of CH4 (blue) from emissions of CO2 and N2O (red).

