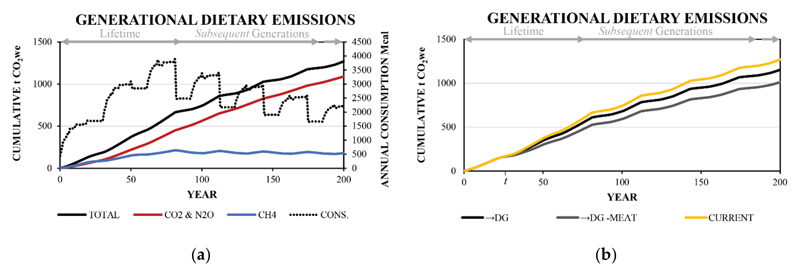
Figure 6.
a) Cumulative generational dietary emission profiles for the Current diet showing the differentiation of CH4 and CO2 and N2O, and b) the cumulative generational dietary emission profiles for the oDG and oDG -Meat diet transitions. The energy consumption each year is shown by the dotted line in a). t denotes the 25th year where a transition from the Current diet to the hypothetical diets occurs.

