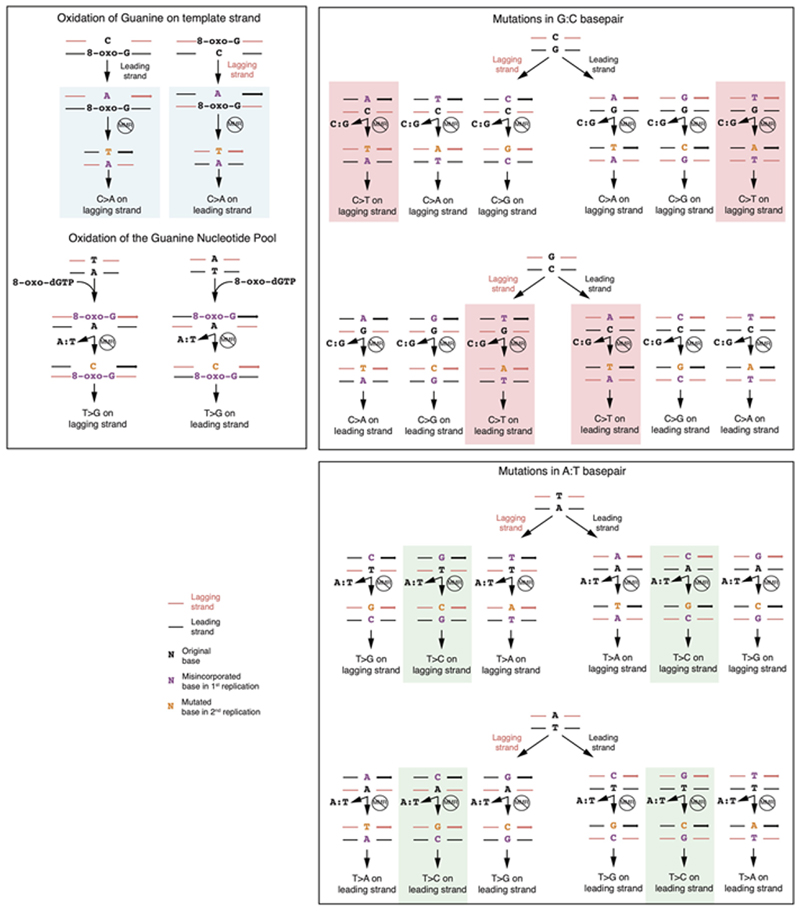
Extended Data Fig. 7. Putative outcomes of all possible base-base mismatches.
Outcomes from 12 possible base-base mismatches. The red and black strands represent lagging and leading strands, respectively. The arrowed strand is the nascent strand. The highlighted pathways are the ones that generate C>A (blue), C>T (red) and T>C mutations (green) in the &#ΔMSH2 mutational signature.

