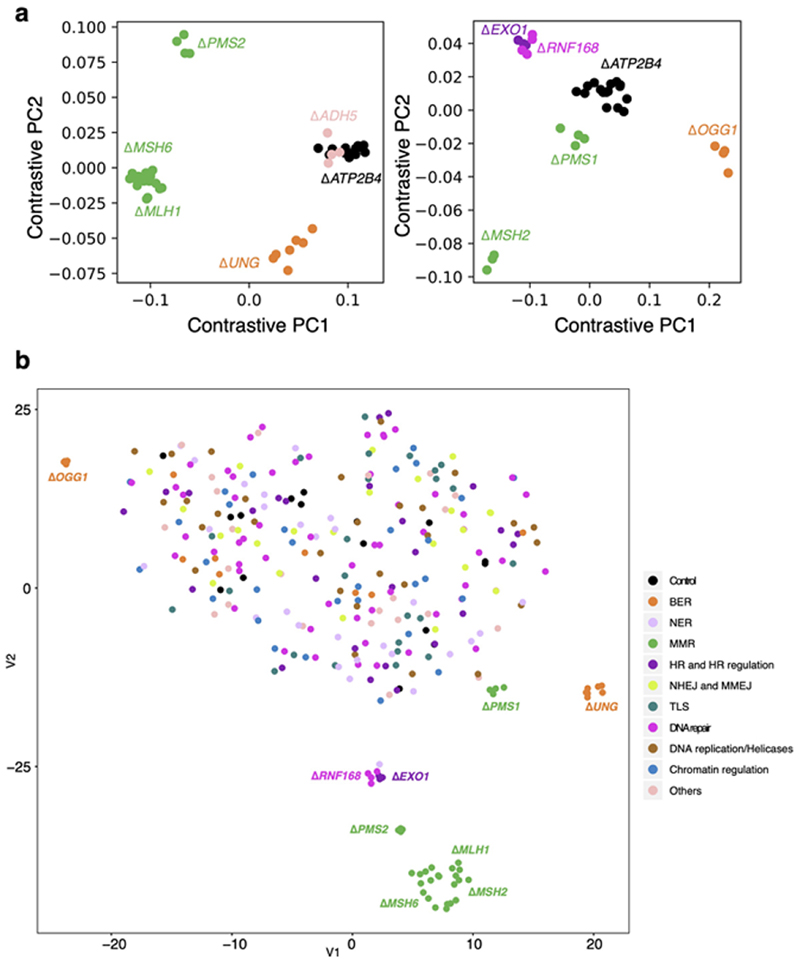
Extended Data Fig. 3. Results of contrastive principal component analysis and t-SNE.
(a) Contrastive principal component analysis (cPCA) was employed to discriminate knockout profiles from control profiles (&#ΔATP2B4). Each figure contains six different genes. Nine gene knockouts separate from the controls. Using this method, &#ΔADH5 did not separate clearly from &#ΔATP2B4, indicative of either having no signature or a weak signature. Dot colours indicate the repair/replicative pathway that each gene is involved: in black - control; green - MMR; orange – BER; dark purple – HR and HR regulation; light purple - checkpoint. Each dot represents a subclone. The number of subclones for each gene knockout (N = 2~4) can be found in Supplementary Table 2. (b) The t-SNE algorithm was applied to discriminate the mutational profiles of gene knockouts from those of control knockouts. Gene knockouts that produce mutational signatures separate clearly from control subclones and other knockouts which do not have signatures. Subclones of the gene knockouts which produce signatures are clustered together, indicating consistency between subclones.

