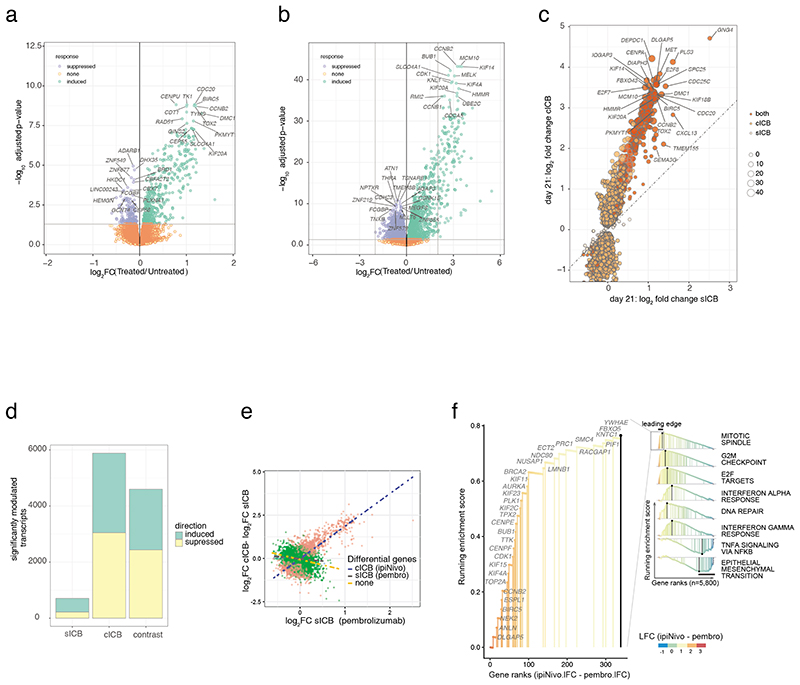
Figure 1. Transcriptomic response to ICB.
1a) Transcripts differentially regulated between pre-treatment and 21 days post-sICB (n=40 paired samples, negative binomial Wald test, Benjamini Hochberg corrected P values); 1b) cICB 21 day response (n=15 paired samples, statistics as per a); 1c) log2 fold change effect of sICB (x-axis) versus cICB for all transcripts significantly regulated in either treatment at day 21, size of point indicates – PsICB/PcICB; 1d) summary of transcript number modulated by each treatment and genes differentially expressed comparing the response of cICB to sICB; 1e,1f) Rank based Gene set enrichment analysis of genes significantly more modulated by cICB identifies pathways preferentially induced or suppressed by combination treatment.

