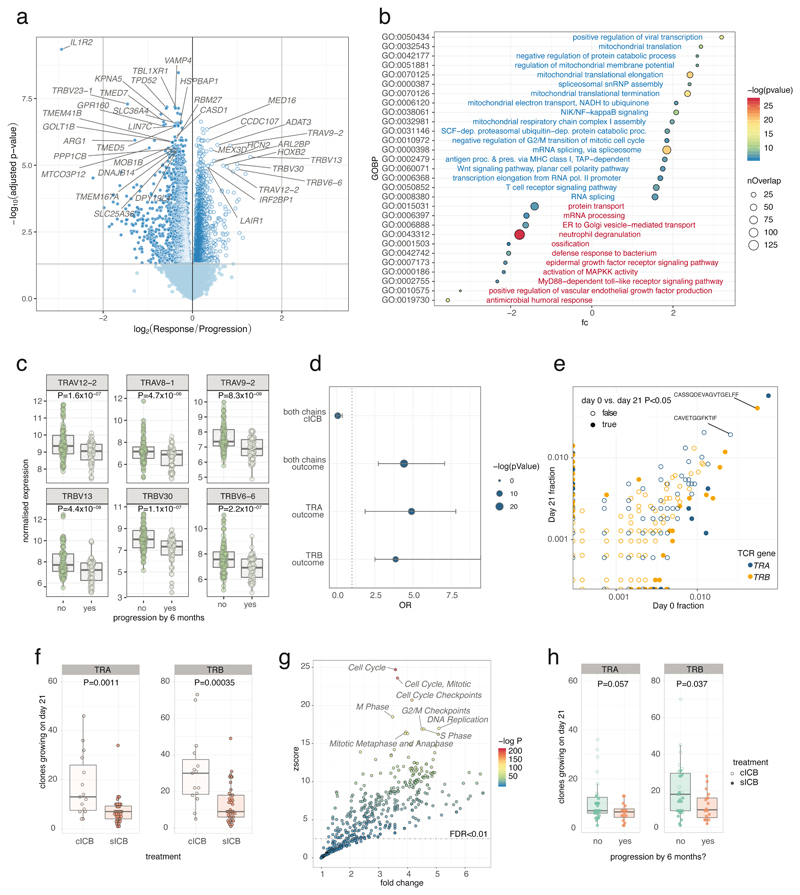
Figure 2. Identification of transcriptomic correlates of long term response.
2a) Transcripts differentially regulated between responders and progressors with direction showing relative expression in responders (n=144 samples from 69 patients, 67 pre-treatment and 77 post-treatment, negative binomial Wald test, Benjamini Hochberg corrected P values); 2b) GOBP pathway analysis of genes preferentially up-regulated (blue) and down-regulated (red) in responders (hypergeometric test); 2c) Boxplots of the most differentially regulated TCR genes between responders and progressors (144 samples, P values are uncorrected negative binomial Wald test returned from Deseq2); 2d) Results from Fisher’s exact test of enrichment of up-regulated TCR encoding versus all transcripts demonstrating no enrichment of TCR encoding genes in those regulated by cICB, whereas both TRAV and TRBV encoding genes are highly enriched amongst those up-regulated in responders (dotted line: OR=1, error bars represent 95% confidence interval); 2e) representative example of day 0 vs. day 21 clones from one patient showing both chains with filled points representing clones showing significant change in frequency; 2f) number of clones increasing in size (P<0.05) was significantly greater in cICB patients (n= 15 cICB, 30 sICB, two-sided Wilcoxon signed-rank Test); 2g) Reactome pathway analysis of genes positively associated with number of clones growing at day 21 (n=54, d21 samples) demonstrated increase in clone size to be strongly linked to expression of genes involved in mitosis (one-sided hypergeometric of genes correlated with clone growth, Supplementary Table 6); 2h) number of clones growing at day 21 (P<0.05) and outcome at six months (n=49 cutaneous melanoma patients, two-sided Wilcoxon signed-rank Test). Lower and upper hinge of box on boxplots represent 25-75th percentiles, central line the median and the whiskers extend to largest and smallest values no greater than 1.5x interquartile range).

