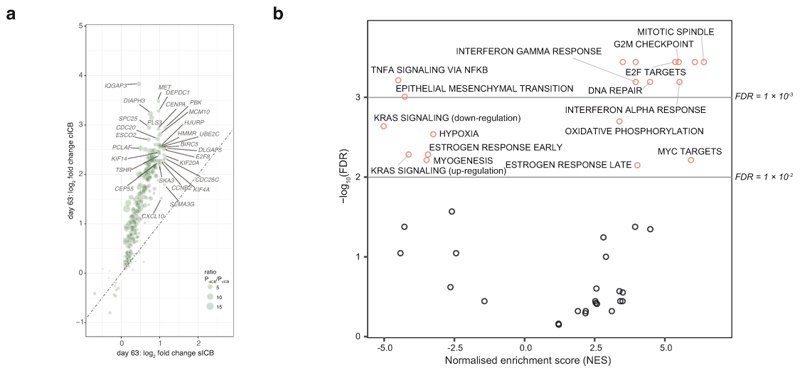
Extended Data Fig.1. Extended transcriptomic response to ICB.
a, Comparison of differential induction of genes by cICB (log fold change y axis) and sICB (log fold change x-axis) at day 63 (n=46 paired samples, 35 sICB, 11 cICB). b, Pathways preferentially upregulated (NES score >0) or supressed by cICB versus sICB as identified by Gene Set Enrichment analysis depicted in Figure 1e,f

