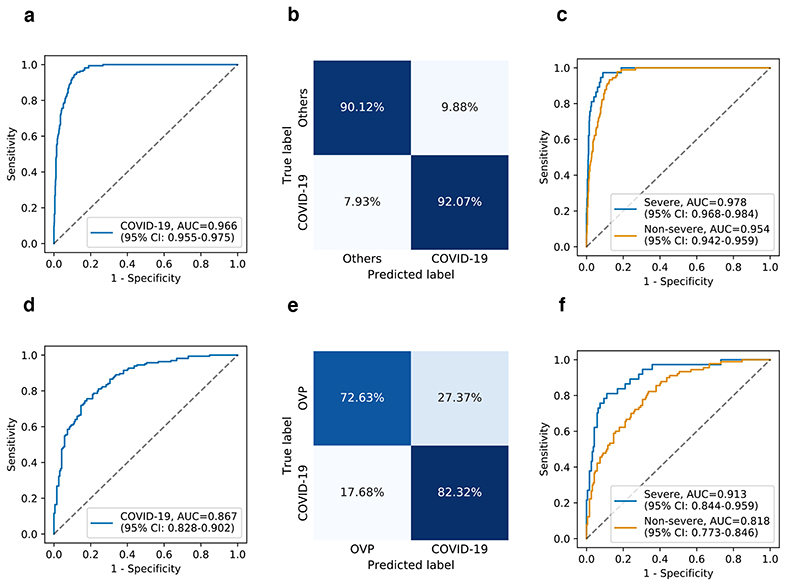
Fig. 4. Performance of the AI system in the identification of COVID-19 pneumonia from CXR images.
ROC curves and normalized confusion matrices for binary classification. a and b, The AI system’s performance on differentiating COVID-19 pneumonia from others (e.g., bacterial pneumonia) on test dataset: AUC = 0.966 (95% CI: 0.955-0.975), sensitivity = 92.07%, specificity = 90.12%. d and e, The AI system’s performance on differentiating COVID-19 pneumonia from other viral pneumonia (OVP) on the test dataset: AUC = 0.867 (95% CI: 0.828-0.902), sensitivity = 82.32%, specificity = 72.63%. c and f, ROC curves showing the AI system’s performance on identifying severe or non-severe COVID-19 from others pneumonia (c) (e.g., bacterial pneumonia) and other types of viral pneumonia (f).

