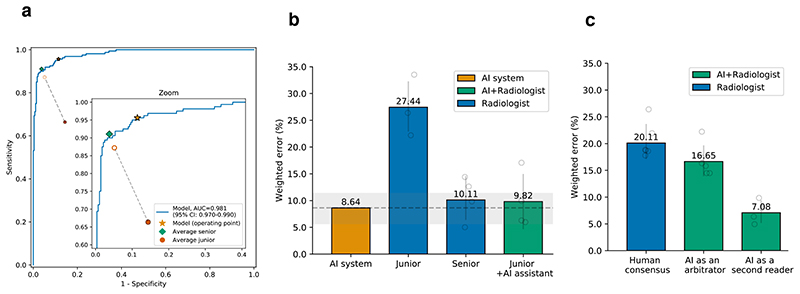
Fig. 6. Performance of the AI system and of radiologists in identifying pneumonia conditions from CXR images.
The performance comparison of four groups: the AI system, an average of a group of four junior radiologists, an average of a group of four senior radiologists, and an average of the group of four junior radiologists with AI assistance. a, The ROC curves for diagnosing viral pneumonia from the rest (other types of pneumonia and normal). The star denoted the operating point of the AI system. Filled dots denoted the junior and senior radiologists’ performance, while the hollow dots denoted the performance of the junior group with the AI’s assistance. Dashed lines linked the paired performance values of the junior group. b, Weighted errors of the four groups based on a penalty metric. P < 0.001 computed using a two-sided permutation test of 10,000 random re-samplings. c, An evaluation experiment on diagnostic performance when the AI system acted as a “second reader” or an “arbitrator”.

