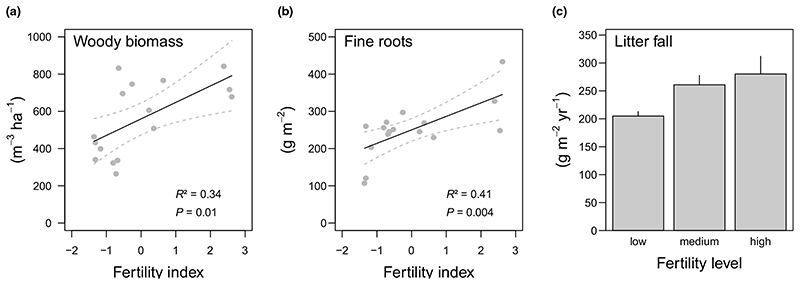
Fig. 2. Relationship between the fertility index and fertility levels of a beech dominated mountain forest and.
(a) above-ground woody biomass of trees, (b) fine root biomass, and (c) annual leaf litter fall, respectively. The fertility index is based on the first axis of a principal component analysis of Ellenberg indicator values for vascular plants at sampling plots (Supporting Information Fig. S2). Given are test statistics of linear regression models (n = 16). Solid and dashed lines show fitted models and 95% confidence intervals, respectively.

