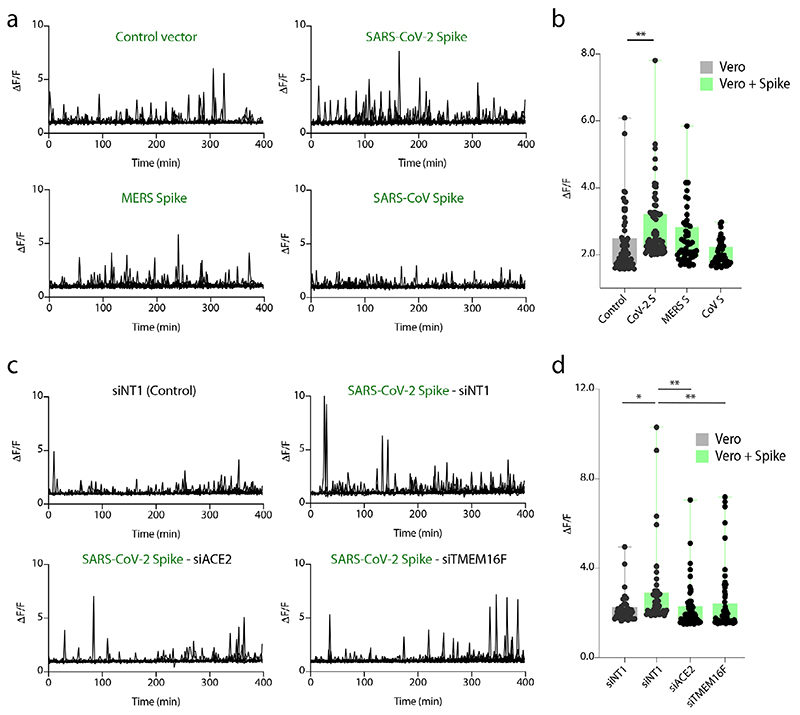
Extended Data Figure 7. Induction of Ca2+ oscillations by coronavirus Spike proteins and upon ACE2 and TMEM16F knockdown.
a and c, Calcium transients over time in Vero cells co-transfected with GCaMP6s and the indicated plasmids and siRNAs. Data are expressed as ΔF/F over time (min); every line is one of at least twelve 180 μm2 ROI per condition, representing a group of 4 GCaMP positive cells on average.
b and d, Amplitude of calcium transient peaks per group of 4 GCaMP-positive cells in average in at least 12 180 μm2 ROI per condition. Data are expressed as ΔF/F; box: 25th-75th percentiles and median, whiskers: min-maxvalues; *P<0.05, **P<0.01, Kruskal-Wallis, two-sided, with Dunn’s correction for multiple comparisons.

