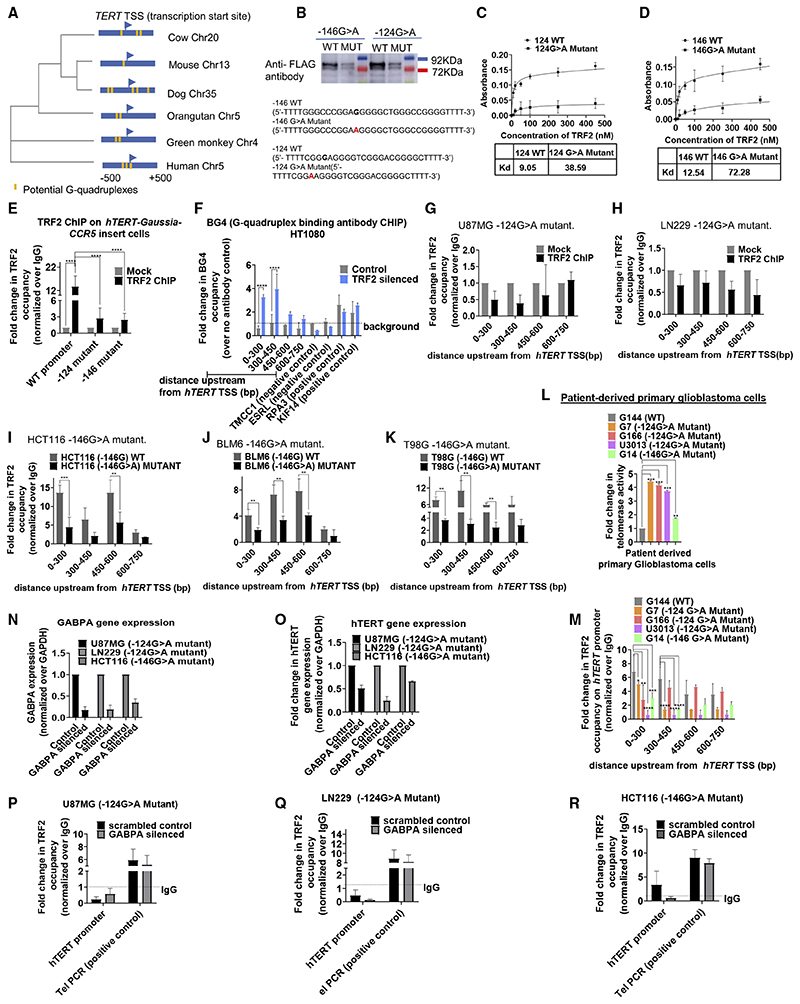
Figure 4. TRF2-induced repression of hTERT is G-quadruplex-dependent.
(A) Phylogenetic tree based on the sequence spanning ±500 bp of the TERT TSS across vertebrates. Presence and position of putative G-quadruplexes (configuration: stem of three Gs and loop size up to 15 bases) in respective organisms is shown in yellow.
(B) Oligonucleotide pull-down from cell lysate of HT1080 cells expressing FLAG-tagged TRF2; 5’-biotin-tagged oligonucleotides from hTERT wild-type (WT) or with mutations (MUT) at the −124th or −146th position were used for pull-down followed by western blot and probed using anti-FLAG antibody. Sequence of respective WT or MUT (base substitution shown in red), with Illi overhangs to minimize steric interactions because of biotin or on ELISA plate (C and D below) given in the bottom panel.
(C and D) ELISA experiments using biotin-tagged hTERT promoter oligonucleotides for WT and the corresponding G > A mutation and increasing concentrations of purified TRF2 protein, WT with −124G > A mutant (C), and WT with corresponding 146G > A mutation (D). Significance for each point was calculated by paired t test, p value across all was p < 0.0001 in both (C) and (D).
(E) qPCR following TRF2 ChIP at the exogenously inserted WT or with −124/−146G > A mutation, hTERT promoter at the CCR5 locus in HEK293T cells relative to IgG (Mock). Scheme of the inserted hTERT promoter with ChIP-qPCR primer positions as in Figure 3A.
(F) qPCR following BG4 ChIP at the hTERT promoter spanning up to 750 bp upstream of TSS: fold-change in BG4 occupancy over experiment using no-antibody control (as per manufacturer’s protocol) shown in TRF2-silenced or scrambled siRNA-treated HT1080 cells (control). Positive and negative controls for BG4 antibody were used as reported earlier.
(G and H) TRF2 ChIP-qPCR spanning 0–750 bp upstream of the hTERT promoter in glioblastoma U87MG (G) and LN229 (H) cell lines with −124G > A promoter mutation relative to IgG ChIP (Mock).
(I–K) TRF2 ChIP-qPCR spanning the hTERT promoter in cancer cell lines with or without the −146G > A promoter mutation: HCT116 cells (I), BLM6 cells (J), or T98G cells (K). Normalized over respective IgG ChIPs (see STAR Methods for details on data analysis). Single base substitutions were made in each case using CRISPR/Cas9-mediated editing.
(Land M) Telomerase activity quantified by ELISA TRAP (see STAR Methods) (L) and TRF2 ChIP-qPCR spanning the hTERT promoter in patient-derived primary glioblastoma cells (M): G144 (wild-type hTERT promoter); G7, G166, U3013 (−124G > A mutant hTERT promoter); and G4 (−146G > A mutant hTERT promoter). (N and O) GABPA (N) and hTERT (O) gene expression following GABPA silencing using qRT-PCR relative to scrambled siRNA control.
(P–R) TRF2 ChIP followed by ChIP-qPCR for TRF2 occupancy at the hTERT mutant promoter following GABPA silencing in U87MG −124G > A mutant (P), LN229 −124G > A mutant (Q), or HCT116 −146G > A(R) mutant cells.
All error bars represent ± SDs from mean values. p values calculated by paired/unpaired t test, for (C)–(F), (L), and (M) two-way ANOVA was used (*p < 0.05, **p < 0.01, ***p < 0.005, ****p < 0.0001).

