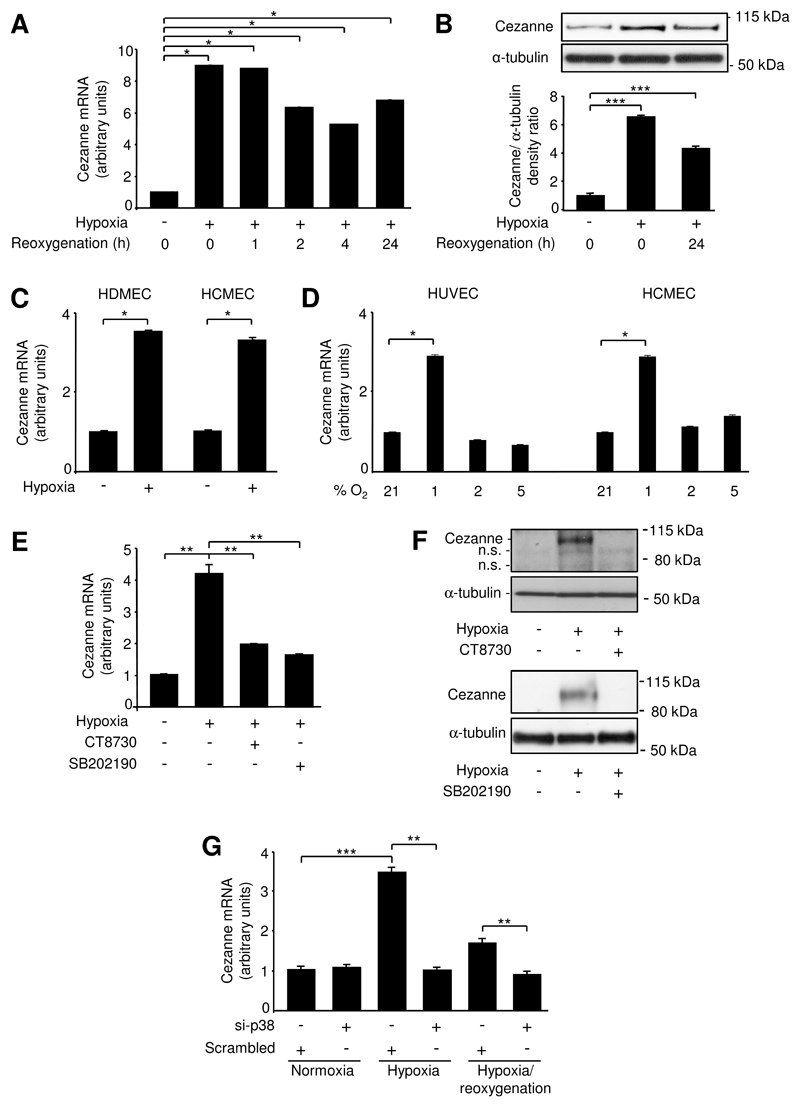
Figure 1. Hypoxia induced Cezanne via p38.
(A,B) HUVEC were exposed to hypoxia (4 h) or hypoxia followed by reoxygenation (1-24 h) or remained untreated. (A) Cezanne transcript levels were quantified by real-time PCR. Data were pooled from 3 independent experiments. (B) Cytosolic lysates were tested by Western blotting using anti-Cezanne antibodies and by using anti-α-tubulin antibodies to assess total protein levels. Representative blots (upper panels) and results from densitometry analysis of five experiments (lower panel) are shown. (C) HDMEC or HCMEC were exposed to hypoxia (4 h) or remained untreated. Cezanne transcript levels were quantified by real-time PCR. Data were pooled from 3 independent experiments. (D) HUVEC or HCMEC were exposed to 1%, 2%, 5% or normoxia (21%) for 4 h. Cezanne transcript levels were quantified by real-time PCR. Data were pooled from 3 independent experiments. (E,F) HUVEC were exposed to CT8730 (1 μM) or SB202190 (50 μM) for 1 h or were treated with vehicle alone and then exposed to hypoxia (4 h) or remained untreated. (E) Cezanne transcript levels were quantified by real-time PCR. (F) Cytosolic lysates were tested by Western blotting using anti-Cezanne antibodies and by using anti-α-tubulin antibodies to assess total protein levels. n.s., non-specific band. (G) HUVEC were treated with p38α-specific siRNA (si-p38) or with a scrambled, non-targeting sequence and were then exposed to hypoxia (4 h) or hypoxia (4 h) followed by reoxygenation (4 h) or remained untreated (normoxia). Cezanne transcript levels were quantified by real-time PCR.

