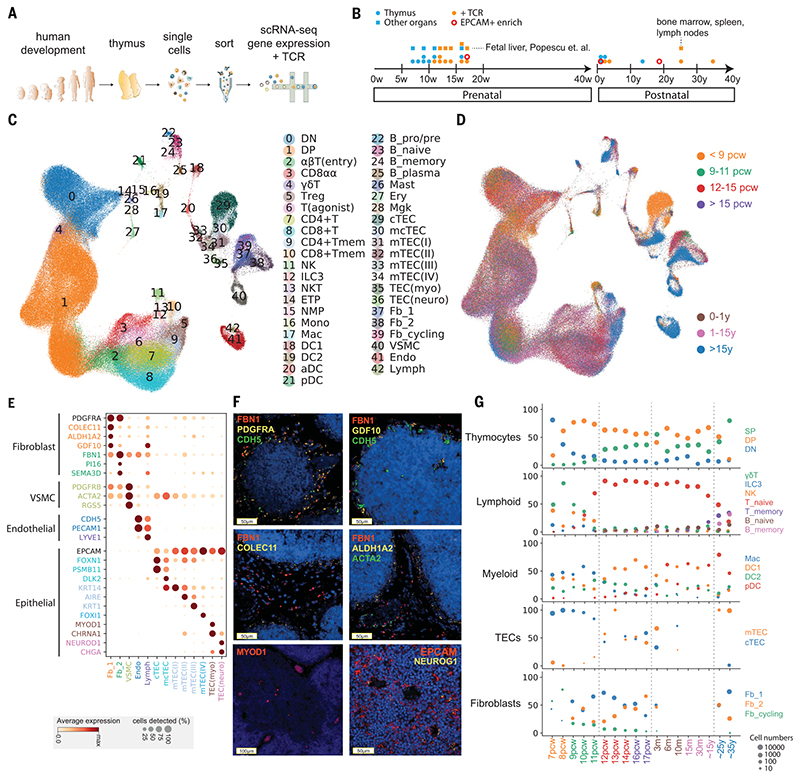
Fig. 1. Cellular composition of the developing human thymus.
(A) Schematic of single-cell transcriptome profiling of the developing human thymus. (B) Summary of gestational stage/age of samples, organs (circles denote thymus; rectangles denote fetal liver or adult bone marrow, adult spleen, and lymph nodes), and 10x Genomics chemistry (colors). (C) UMAP visualization of the cellular composition of the human thymus colored by cell type (DN, double-negative T cells; DP, double-positive T cells; ETP, early thymic progenitor; aDC, activated dendritic cells; pDC, plasmacytoid dendritic cells; Mono, monocyte; Mac, macrophage; Mgk, megakaryocyte; Endo, endothelial cells; VSMC, vascular smooth muscle cells; Fb, fibroblasts; Ery, erythrocytes). (D) Same UMAP plot colored by age groups, indicated by post-conception weeks (PCW) or postnatal years (y). (E) Dot plot for expression of marker genes in thymic stromal cell types. Here and in later figures, color represents maximum-normalized mean expression of marker genes in each cell group, and size indicates the proportion of cells expressing marker genes. (F) RNA smFISH in human fetal thymus slides with probes targeting stromal cell populations. Top left: Fb2 population marker FBN1 and general fibroblast markers PDGFRA and CDH5. Top right: Fb1 marker GDF10, FBN1, and CDH5. Middle left: Fb1 marker COLEC11 and FBN1. Middle right: Fb1 marker ALDH1A2, VSMC marker ACTA2, and FBN1. Bottom left: TEC(myo) marker MYOD1. Bottom right: Epithelial cell marker EPCAM and TEC(neuro) marker NEUROG1. Data are representative of two experiments. (G) Relative proportion of cell types throughout different age groups. Dot size is proportional to absolute cell numbers detected in the dataset. Statistical testing for population dynamics was performed by t tests using proportions between stage groups. The x axis shows age of samples, which are colored in the same scheme as (D).

