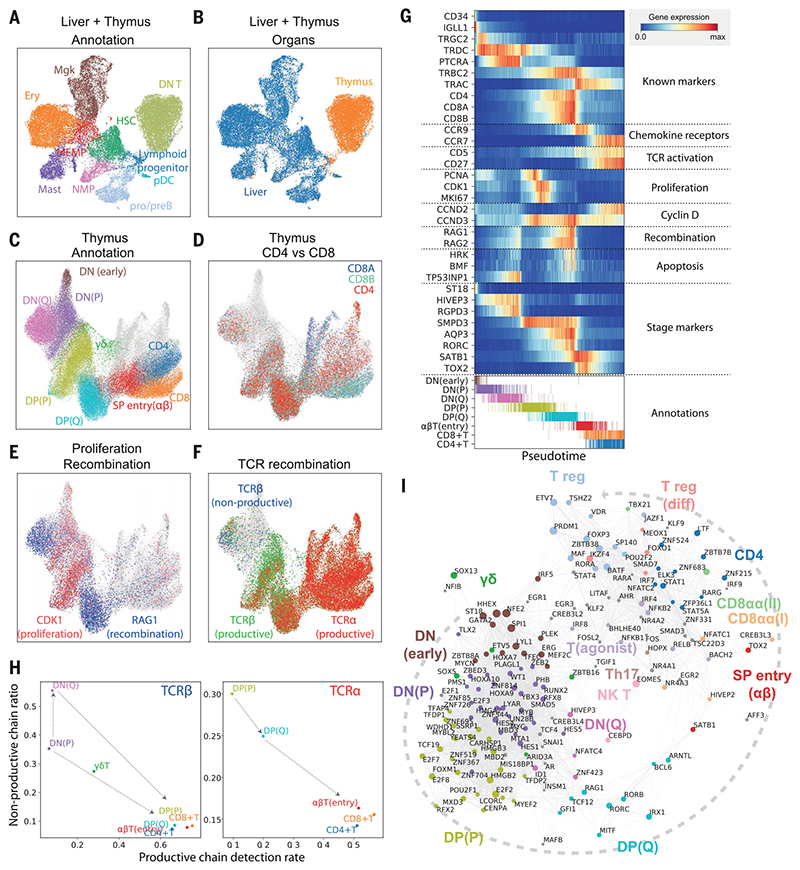
Fig. 2. Thymic seeding of early thymic progenitors (ETPs) and T cell differentiation trajectory.
(A) UMAP visualization of ETP and fetal liver hematopoietic stem cells (HSCs) and early progenitors. NMP, neutrophil-myeloid progenitor; MEMP, megakaryocyte/erythrocyte/mast cell progenitor. (B) The same UMAP colored by organ (liver in blue, thymus in yellow/red). (C) UMAP visualization of developing thymocytes after batch correction. DN, doublenegative T cells; DP, double-positive T cells; SP, single-positive T cells; P, proliferating; Q, quiescent). The data contain cells from all sampled developmental stages. Cells from abundant clusters are downsampled for better visualization. The reproducibility of structure is confirmed across individual samples. Unconventional T cells are in gray. (D to F) The same UMAP plot showing CD4, CD8A, and CD8B gene expression (D), CDK1 cell cycle and RAG1 recombination gene expression (E), and TCRa, productive TCRb, and nonproductive TCRβ VDJ genes (F). (G) Heat map showing differentially expressed genes across T cell differentiation pseudotime. Top: The x axis represents pseudo-temporal ordering. Gene expression levels across the pseudotime axis are maximum-normalized and smoothed. Genes are grouped by their functional categories and expression patterns. Bottom: Cell type annotation of cells aligned along the pseudotime axis. Colors are as in (C). (H) Scatterplot showing the rate of productive chain detection within cells in specific cell types (x axis) and the ratio of nonproductive/productive TCR chains detected in specific cell types (y axis). Left: TCRβ; right, TCRa. (I) Graph showing correlation-based network of transcription factors expressed by thymocytes. Nodes represent transcription factors; edge widths are proportional to the correlation coefficient between two transcription factors. Transcription factors with significant association to specific cell types are depicted in color. Node size is proportional to the significance of association to specific cell types.

