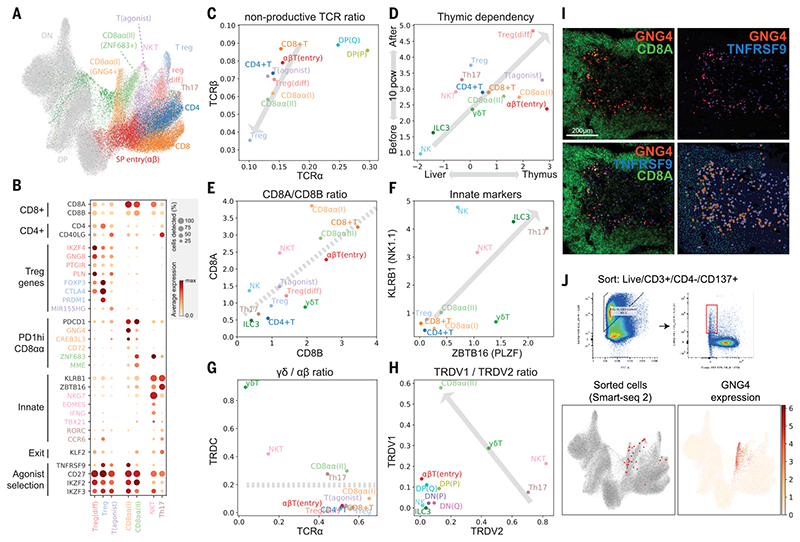
Fig. 3. Identification of GNG4+ CD8αα T cells in the thymic medulla.
(A) UMAP visualization of mature T cell populations in the thymus. Axes and coordinates are as in Fig. 2C. (The cell annotation color scheme used here is maintained throughout this figure.) (B) Dot plot showing marker gene expression for the mature T cell types. Genes are stratified according to associated cell types or functional relationship. (C) Scatterplot showing the ratio of nonproductive/productive TCR chains detected in specific cell types in TCRa chain (x axis) and TCRβ chain (y axis). The gray arrow indicates a trendline for decreasing nonproductive TCR chain ratio in unconventional versus conventional T cells. (D) Scatterplot showing the relative abundance of each cell type between fetal liver and thymus (x axis) and before and after thymic maturation (delimited at 10 PCW) (y axis). Gray arrow indicates trendline for increasing thymic dependency. (E to H) Scatterplots comparing the characteristics of unconventional T cells based on CD8A versus CD8B expression levels (E), KLRB1 versus ZBTB16 expression levels (F), TCRa productive chain versus TRDC detection ratio (G), and TRDV1 versus TRDV2 expression levels (H). Gray arrows or lines are used to set boundaries between groups [(E), (G), (H)] or to indicate the trend of innate marker gene expression (F). (I) RNA smFISH showing GNG4, TNFRSF9, and CD8A in a 15 PCW thymus. Lower right panel shows detected spots from the image on top of the tissue structure based on 4’,6-diamidino-2-phenylindole (DAPI) signal. Color scheme for spots is the same as in the image. (J) FACS gating strategy to isolate CD8αα(I) cells (live/CD3+/CD4^/CD137+) and Smart-seq2 validation of FACS-isolated cells projected to the UMAP presentation of total mature T cells from the discovery dataset (lower left). GNG4 expression pattern is overlaid onto the same UMAP plot (lower right).

