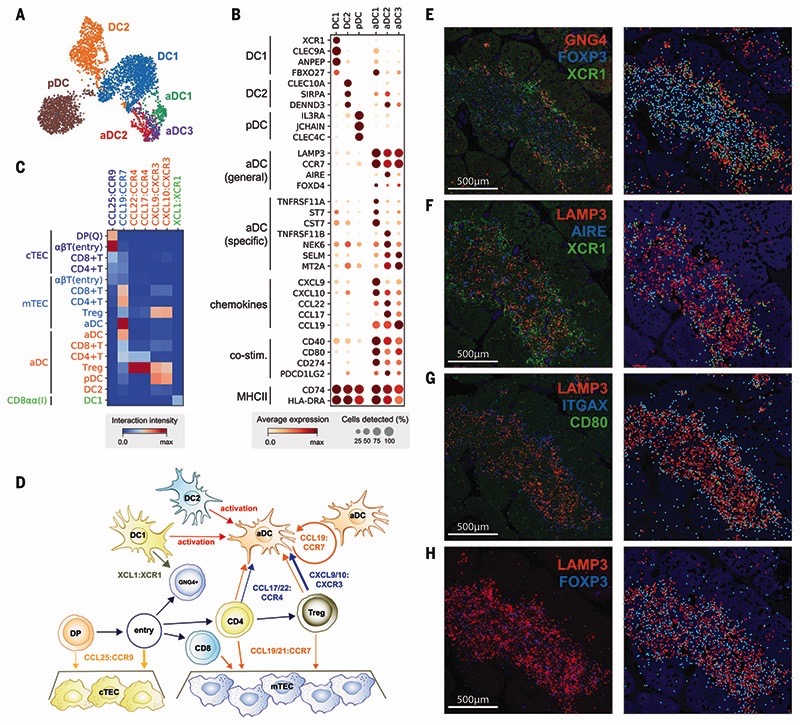
Fig. 4. Recruitment and activation of dendritic cells for thymocyte selection.
(A and B) UMAP visualization of thymic DC populations (A) and dot plot of their marker genes (B). (C) Heat map of chemokine interactions among T cells, DCs, and TECs, where the chemokine is expressed by the outside cell type and the cognate receptor by the inside cell type. (D) Schematic model summarizing the interactions of TECs, DCs, and T cells. The ligand is secreted by the cell at the beginning of an arrow, and the receptor is expressed by the cell at the end of that arrow. (E) Left: RNA smFISH detection of GNG4, XCR1, and FOXP3 in 15 PCW thymus. Right: Computationally detected spots are shown as solid circles over the tissue structure based on DAPI signal. Color schemes for circles are the same as in the image. (F to H) Sequential slide sections from the same sample are stained for the detection of LAMP3, AIRE, and XCR1 (F), LAMP3, ITGAX, and CD80 (G), and LAMP3 and FOXP3 (H). Spot detection and representation are as in (E). Data are representative of two experiments.

