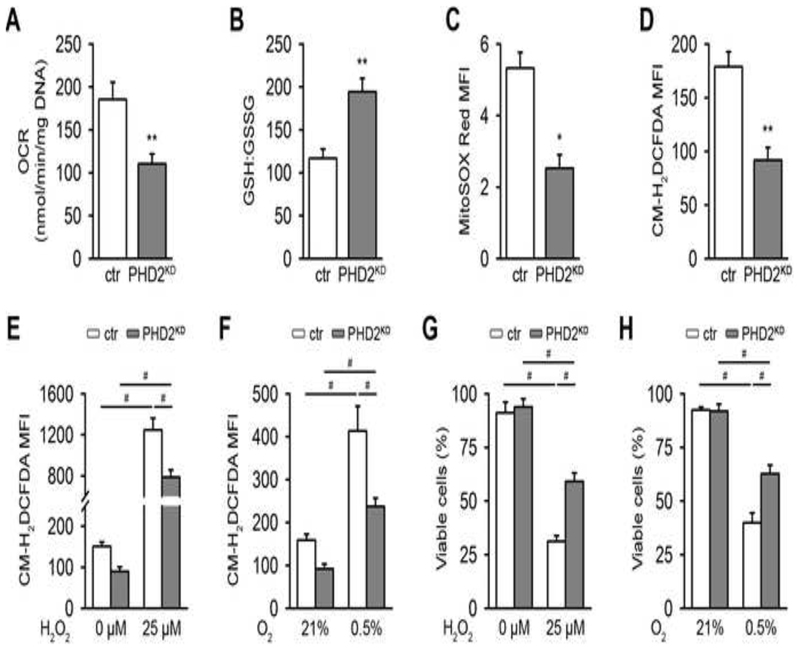
Figure 2. PHD2KD Cells Are Metabolically Reprogrammed.
(A) Basal oxygen consumption rate (OCR) of cultured control (ctr) and PHD2KD mPDC (n=6).
(B) Ratio of reduced glutathione (GSH) to oxidized glutathione (GSSG) (n=6).
(C-D) Mean fluorescent intensity (MFI) of mitochondrial (MitoSOX Red; C) or intracellular ROS levels (CM-H2DCFDA; D) by flow cytometry analysis (n=6-9).
(E-F) Intracellular ROS levels after treatment with 25 μM H2O2 (E) or culture in 0.5% oxygen (O2; F) (n=6).
(G-H) Cell viability analysis after treatment with 25 μM H2O2 (G) or culture in 0.5% O2 (H), by AnxV-PI flow cytometry (n=9).
Data are means ± SEM. *p<0.05 vs. ctr, **p<0.01 vs. ctr (Student’s t-test), #p<0.05 (ANOVA).

