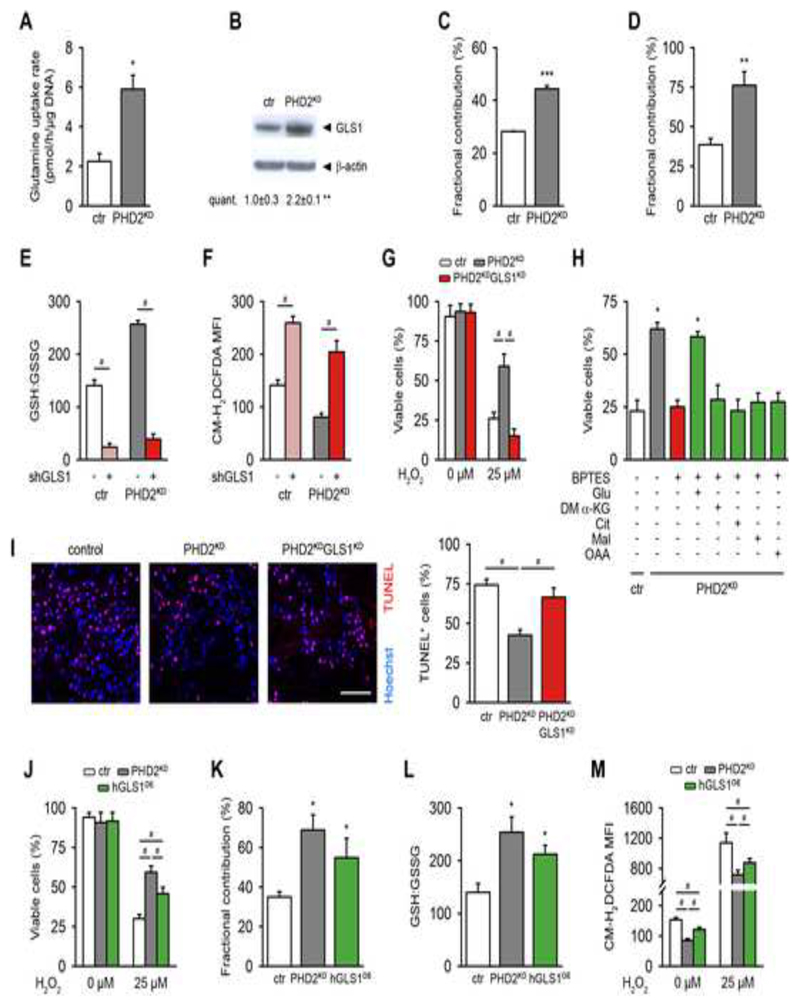
Figure 3. GLS1 Regulates Glutamine-mediated ROS Scavenging in PHD2KD Cells and Contributes to Cell Survival.
(A) Glutamine uptake rate in cultured control (ctr) and PHD2KD cells (n=6).
(B) GLS1 and β-actin immunoblot (n=3).
(C-D) Fractional contribution of [U-13C]-glutamine to glutamate (C) and GSH (D) (n=3-6).
(E-F) GSH to GSSG levels (E) and total intracellular ROS levels (F) in control and PHD2KD cells after genetic silencing of GLS1 (scrambled shRNA (shScr: -) or shGLS1 (+)) (n=6).
(G) Control, PHD2KD and PHD2KDGLS1KD cell viability after treatment with 25 μM H2O2 (n=6). PHD2KDGLS1KD cells are PHD2KD cells transduced with shGLS1; ctr and PHD2KD cells are transduced with shScr.
(H) Rescue of cell viability of BPTES-treated PHD2KD cells during oxidative stress (25 μM H2O2) with glutamate (Glu), but not with dimethyl α-ketoglutarate (DM α-KG), citrate (Cit), malate (Mal) or oxaloacetate (OAA) (n=9).
(I) TUNEL immunostaining of the scaffold center 3 days after implantation, and quantification (scale bar, 100 μm; n=4).
(J) Cell viability of control, PHD2KD and hGLS1-overexpressing (hGLS1OE) cells after treatment with 25 μM H2O2 (n=6).
(K) Fractional contribution of [U-13C]-glutamine to GSH (n=6).
(L) Ratio of GSH to GSSG (n=6).
(M) Total intracellular ROS levels with and without H2O2 treatment (n=6).
Data are means ± SEM. *p<0.05 vs. ctr, **p<0.01 vs. ctr, ***p<0.001 vs. ctr (Student’s t-test), #p<0.05 (ANOVA).

