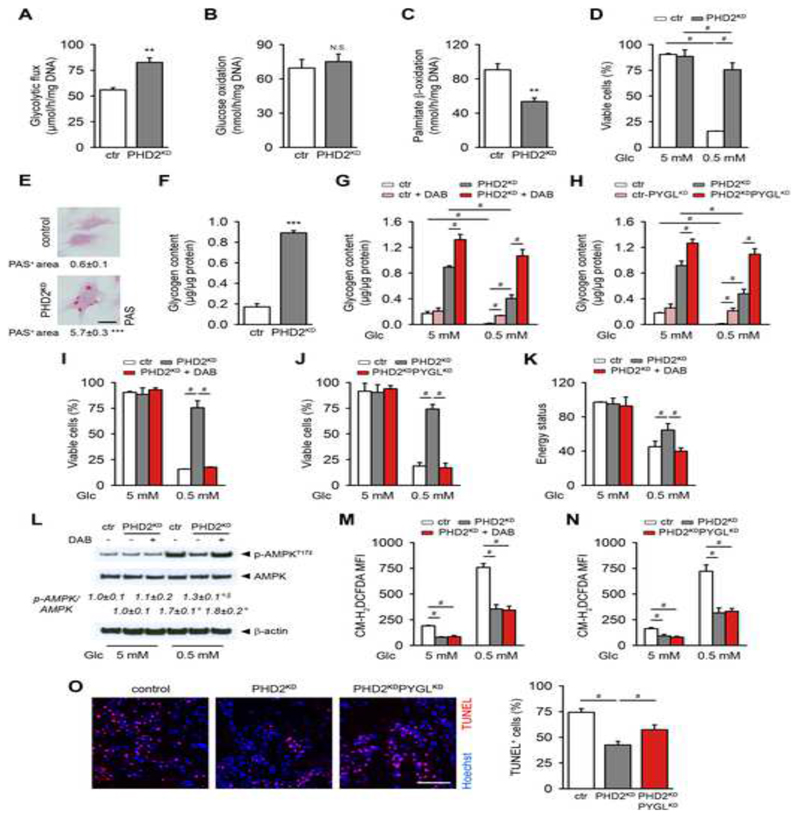
Figure 4. Glycogen Storage Contributes to PHD2KD Cell Survival by Supplying Energy.
(A) Glycolytic flux of cultured control (ctr) and PHD2KD mPDC (n=9).
(B) Glucose oxidation rate (N.S. is not significant, n=9).
(C) Palmitate β-oxidation (n=6).
(D) Cell viability during normal (5 mM glucose) or glucose-deprived conditions (0.5 mM glucose) (n=9).
(E-F) Intracellular glycogen deposition, quantified after periodic acid-Schiff (PAS) staining (E) or determined after extraction (F) (n=9).
(G-H) Cellular glycogen content after inhibition of PYGL with DAB (G) or shRNA (PYGLKD; H) (n=6).
(I-J) Cell viability of control, PHD2KD and PHD2KD cells after inhibition of PYGL. PYGL was inhibited in PHD2KD cells using DAB (I) or shRNA (PHD2KDPYGLKD; J) (n=4-6).
(K) Energy status (ratio of ATP to AMP levels) (n=3).
(L) P-AMPKT172, AMPK and β-actin immunoblot, with quantification of p-AMPKT172 to AMPK ratio (n=3).
(M-N) Intracellular ROS levels in control, PHD2KD and PHD2KD cells after inhibition of PYGL. PYGL was inhibited in PHD2KD cells using DAB (M) or shRNA (PHD2KDPYGLKD; N) (n=4-6).
(O) TUNEL immunostaining with quantification of TUNEL+ cells in the scaffold center at day 3 after implantation (scale bar, 100 μm; n=4).
Data are means ± SEM. **p<0.01 vs. ctr, ***p<0.001 vs. ctr (Student’s t-test), #p<0.05, °p<0.05 vs. ctr in normal culture conditions, §p<0.05 vs. ctr during glucose deprivation (ANOVA).

