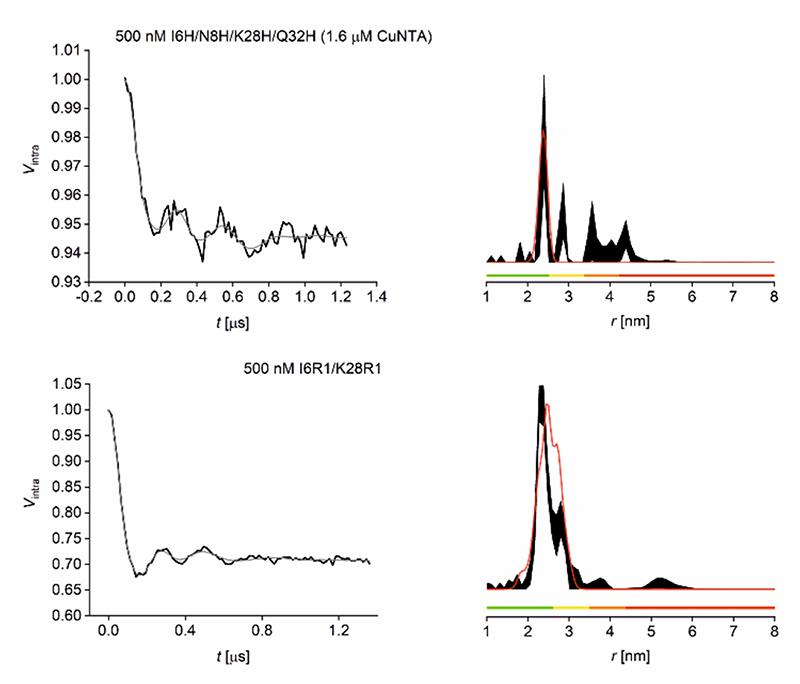
Figure 2.
500 nM GB1 CuII-CuII RIDME and nitroxide-nitroxide PELDOR Q-band data at 30 and 50 K, respectively. Top: RIDME data for 500 nM GB1 tetra-histidine with 1.6 μM CuII-NTA added. Bottom: PELDOR data for 500 nM GB1 I6R1/K28R1. Left: Background-corrected data (black) and fit (grey). Right: Corresponding distance distributions given as 95% confidence intervals (± 2σ) with 50% noise added for error estimation during statistical analysis; simulated distance distributions are shown in red. Color bars represent reliability ranges (green: shape reliable; yellow: mean and width reliable; orange: mean reliable; red: no quantification possible).

